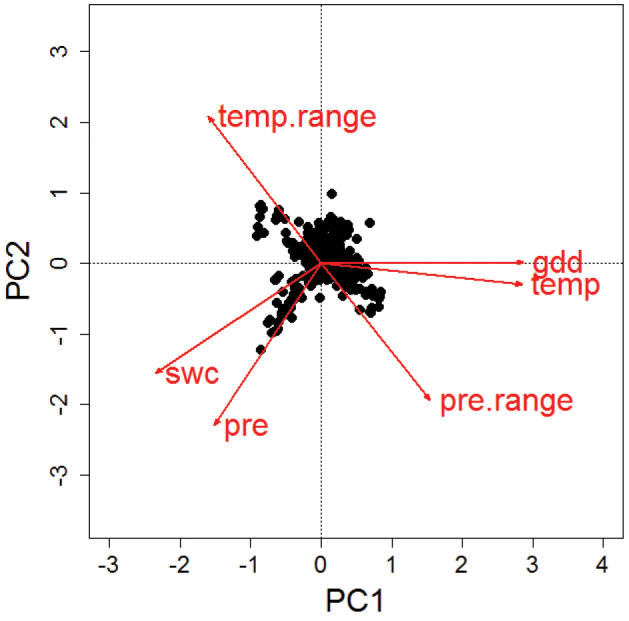
Figure 2.

Results from a principal component analysis of the species-specific mean values of six different climate variables. Mean values per species have been calculated based on the observed records per 50 km × 50 km CGRS grid cell across a species’ European distribution. PC1 explained 58% and PC2 32% of the variability. Niche characteristics according to annual temperature (temp) and growing degree days until August (gdd) are highly correlated. Also, the two measures of water availability, annual precipitation (pre) and soil water content (swc) show some similarity, while the indicators of annual range in precipitation (pre.range) and temperature (temp.range) are negatively correlated. In spite of these similarities, aspects of energy, water and their annual variability can be assessed independently with a choice of at least three of the indicators.
