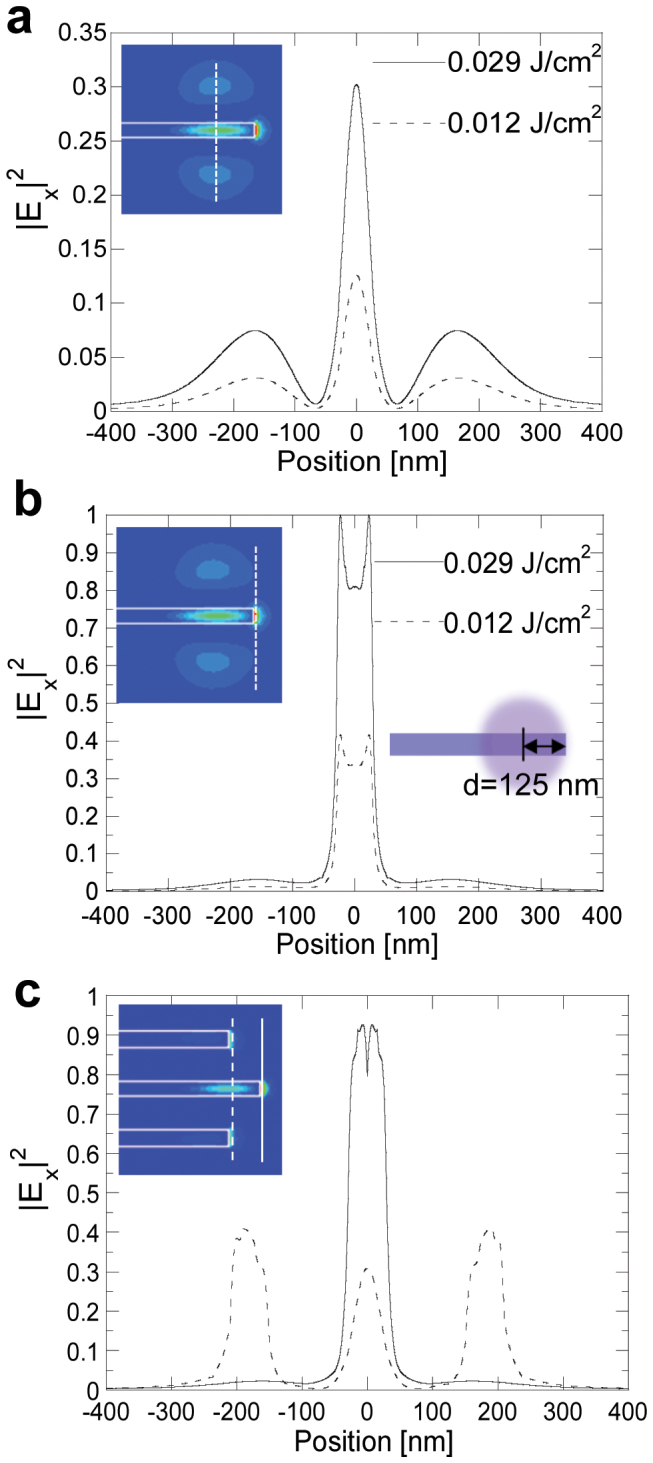
Figure 3. Computational results of electrical field (|Ex|2) distributions during nanowire synthesis.

The distribution for a single nanowire at two laser fluences is displayed along two scan lines in (a) and (b). The left inset in (b) shows the highest intensity is located at the wire tip. (c), Intensity distribution for triple nanowires. In (c) the spacing between wires is 180 nm and the central wire is 125 nm longer than those wires to the side. The simulated wires are 60 nm wide, 30 nm high with a semi-circular cross section. The intensity was normalized to the maximum value at the fluence of 0.029 J/cm2. For all simulations, the electric field polarization of the incoming laser was parallel to the wires.
