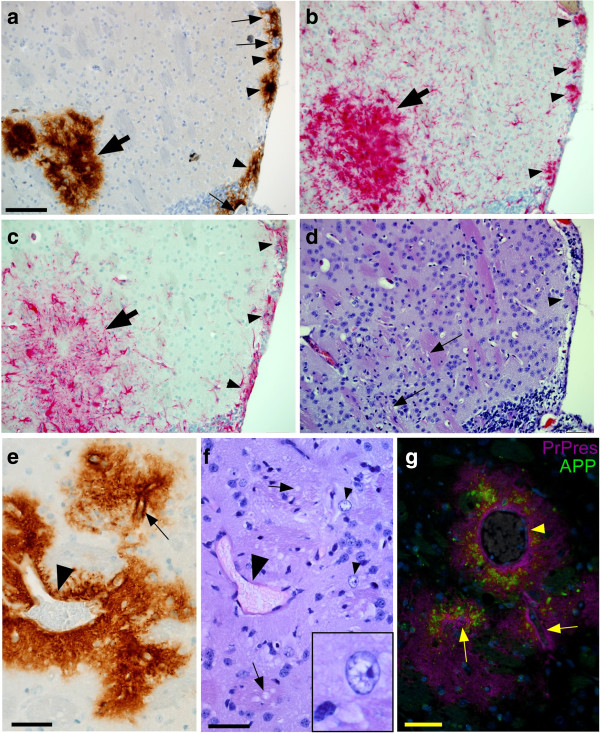
Figure 6.
Neuropathology in scrapie-infected tg44 mice at preclinical times. (a-d) Panels show striatum and subependymal regions adjacent to needle track at 81 dpi. (a) PrPres visualized by D13 staining. Arrowheads show subependymal plaques often associated with blood vessels (arrows). On left side of field is a large plaque at the end of the needle track (bold arrow). (b) Staining with anti-Iba1 shows infiltration of microglia and/or macrophages often with an activated morphology consisting of larger cell bodies and thickened processes. Subependymal (arrowheads) and needle track (bold arrow) accumulations of cells correlate with PrPres plaques seen in (a). (c) Staining with anti-GFAP shows accumulation of activated astroglia in areas of subependymal plaques (arrowheads) and needle track (bold arrow). (d) H&E staining of same field shown in (a-c). In needle track area, arrows indicate small vacuoles in white matter of striatum. Near lower arrow hypercellularity and distorted architecture can be seen. Arrowhead indicates a subependymal plaque. Apparent vacuolation of subependymal region is likely an artifact. (e) Perivascular PrPres plaque in striatum of tg44 mouse at 160 dpi. A large vein (arrowhead) and prominent capillary (arrow) can be seen. (f) H&E staining of section in same area as (e) shows white matter vacuoles (arrows) and two nuclei with apparent vacuoles (arrowheads). Inset shows higher magnification of one nucleus with vacuoles. Large vein is indicated by larger arrowhead. (g) In striatum of same mouse shown in (e) and (f), double-staining shows APP accumulation (green) associated with PrPres plaques (magenta) surrounding capillaries (arrows) and large vein (arrowhead). Scale is same in panels a-d, and bar shown in (a) represents 50 μm. Other bars are as follows: e, 65 μm; f, 25 μm; g, 50 μm.

