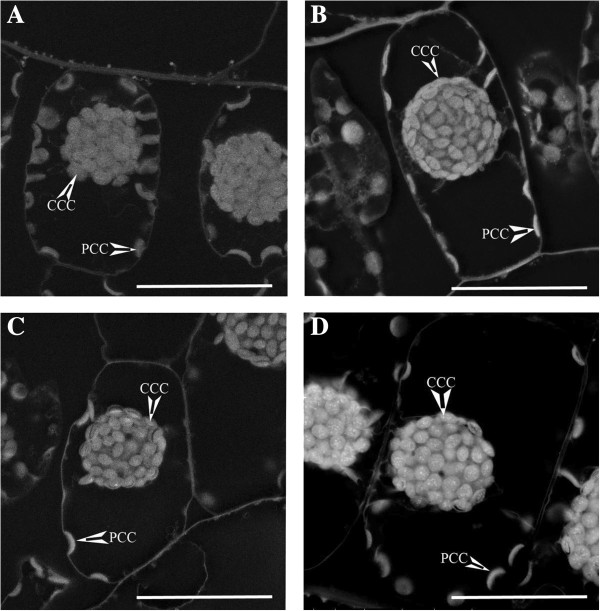
Figure 4.
Representative images from SEM backscattering detection of DAB stained Bienertia chlorenchyma cells (For quantification of results see Table 2). Image A is the control for H2O2 detection (no DAB was included). Image B is the stain for H2O2, where DAB was allowed to react with in vivo produced H2O2. Image C is the control for peroxidase activity (no H2O2 was added). Image D is the stain for peroxidase activity, where H2O2 is supplied in excess. CCC = central compartment chloroplast, PCC = peripheral compartment chloroplast. Scale Bar = 50 μm.

