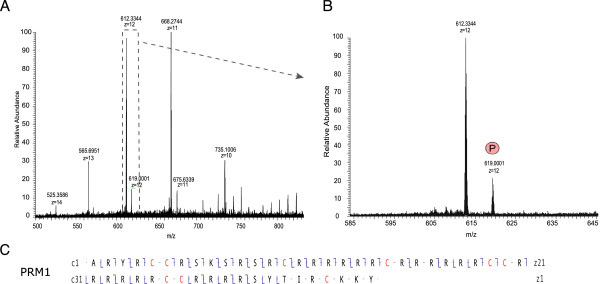
Figure 4.

PRM1 forms identified with a top-down strategy for intact protein analysis. A) MS1 trace of the most abundant charge states of PRM1 (+10 to +14). B) MS1 trace of the 12+ charged unmodified PRM1 (no post-translational modification (PTM)), and PRM1 modified by phosphorylation (p). C) MS2 sequence coverage of unmodified PRM1. The sequence coverage is indicated and shows c ions from the right (⌉) and z ions from the left (⌊).
