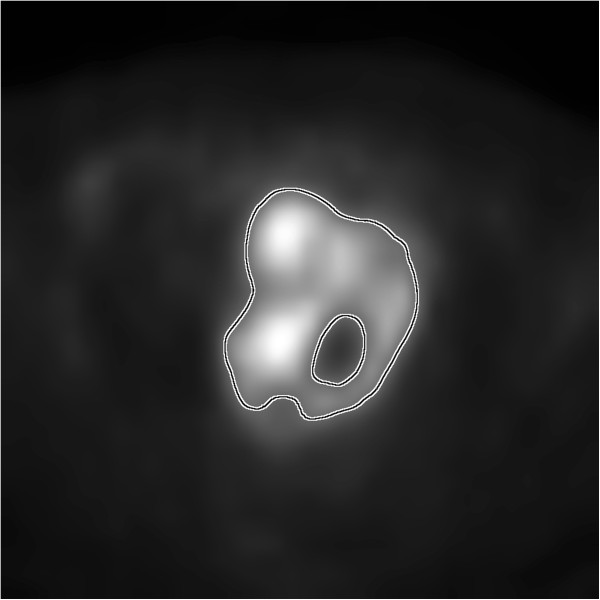
Figure 1.

Shown is an example of a cervical carcinoma imaged via FDG-PET. The black and white contour approximately indicates the defined tumor boundary. Within, there are clear variations in the grayscale intensity. It is these variations researchers seek to objectively quantify such that inter-patient comparisons of intra-tumor uptake heterogeneity can be made. The image edges correspond to 20 cm within the patient.
