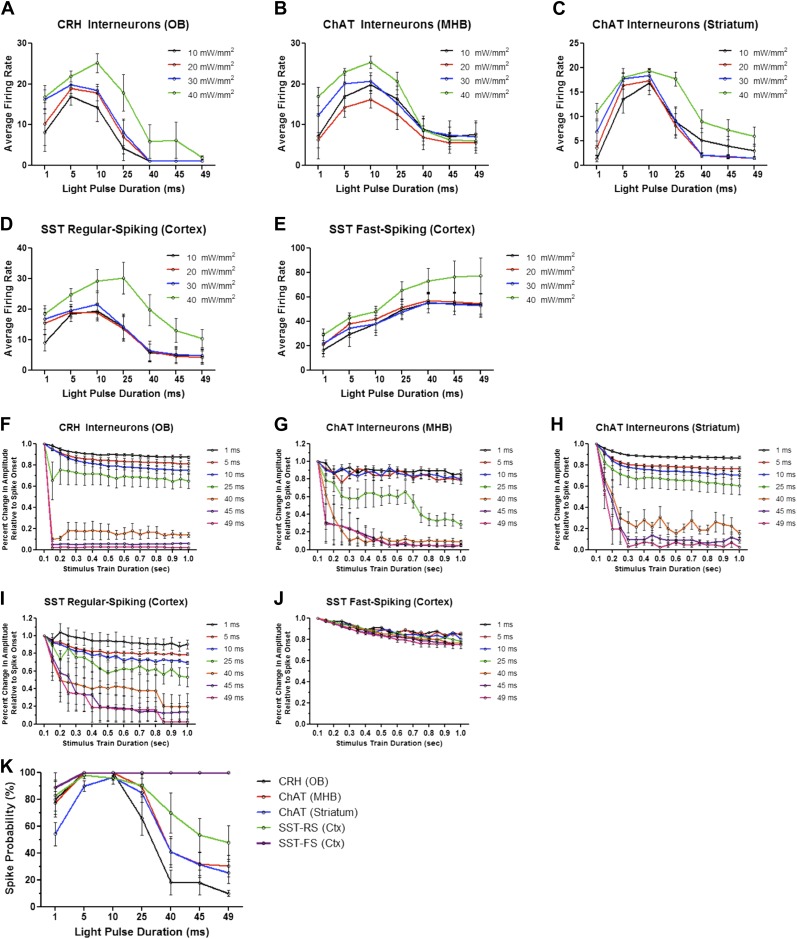
Figure 4. Firing dynamics of diverse interneurons in response to varying light pulse duration.
Average firing rates of ChR2-expressing (A) CRH (N = 5–10 cells/intensity from 4 animals), (B) ChAT MHB (N = 4–9 cells/intensity from 5 animals), (C) ChAT striatal (N = 6–15 cells/intensity from 5 animals), (D) regular-spiking SST (N = 5–9 cells/intensity from 4 animals), and (E) fast-spiking SST interneurons (N = 4-9 cells/intensity from 4 animals) in response to variable light intensity and pulse duration (20 Hz). (F–J) Interneuron amplitudes, normalized to spike onset, in response to increasing pulse width. (K) Spike probabilities of various interneuron cell types in response to increasing pulse widths. Data points represent averages ± SEM. OB = Olfactory Bulb, MHB = Medial Habenula.

