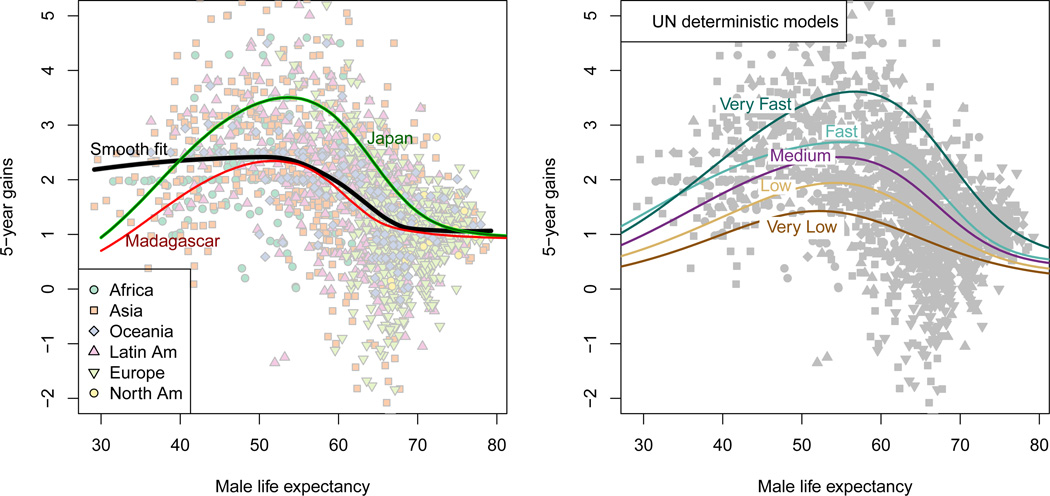
Figure 1.
Observed five-year gains in life expectancy, plotted against the life expectancy at the beginning of the five-year period. UN estimates for 158 countries from 1950 to 2005 are included in this figure (n = 1, 738). Each point represents an observed five-year gain in life expectancy within a country. The black line is a locally-weighted polynomial (lowess) regression of the observations, which highlights the non-constant rate of gains in life expectancy. Included in the left plot are the fitted posterior median double-logistic functions for Japan and Madagascar from our model. The UN deterministic models are included in the right plot. (Note: 31 observations (1.8%) are outside the range of the plot and not shown, but were included in the local regression.)

