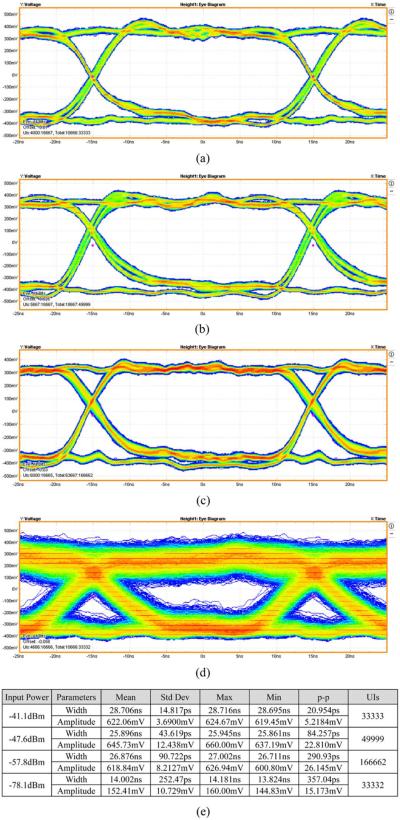
Fig. 13.
Measured eye diagram of the received baseband signal with different input signal strengths using a 33 Mbps pseudorandom test pattern. (a)–41.1 dBm input power. (b) –47.6 dBm input power. (c) –57.8 Bm input power. (d) –78.1 dBm input power. (e) Based band data pulse width and amplitude deviation summary.

