
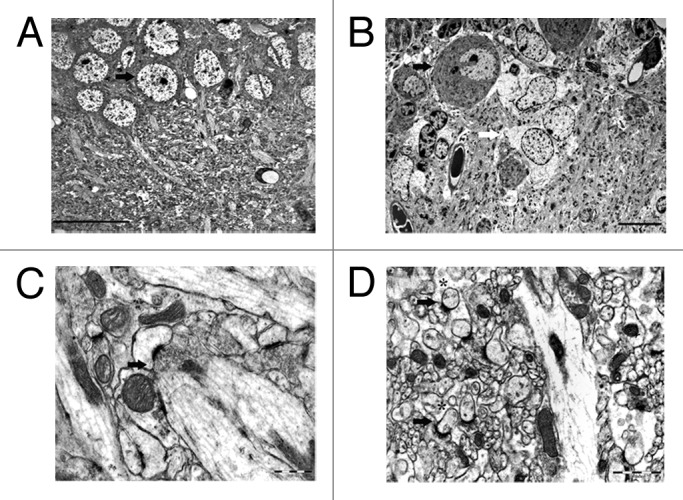
Figure 1. Electron micrographs of CA1 pyramidal cells (arrow) in the hippocampus (A) and Purkinje cells (black arrow) tightly enveloped by Bergmann glial cells (white arrow) in the cerebellum (B) illustrating typical structural organizations of the brain regions. A representative image of a type I synapse (arrow) in stratum radiatum of the hippocampus (C) and cerebellar molecular layer (D) illustrating prominent differences in the degree of synaptic ensheathment by glia cells (asterisks). Scale bars: 20 μm (A), 10 μm (B), 0.5 μm (C), 1 μm (D).