
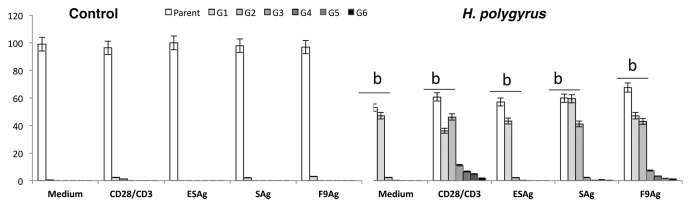
Figure 2. Mean percentage of CD4 T cells in different divisions of proliferation process in control uninfected mice and mice infected with H. polygyrus. MLN cells were stained with CFSE and were adjusted to 2 × 10⁵ cells ⁄well in 96-well plates Cells were in medium alone or were stimulated with CD28/CD3 antibody and H. polygyrus antigens in a final volume of 200 μL. The plates were incubated at 37 °C with 5% CO2 for 7 d. The cells were harvested and stained with anti-CD4 mAb. Flow cytometry FACS data analysis was performed using II Software (B). The numerical values for proportions of proliferated cells at each cell generation were used for statistical analysis. Data from individuals were pooled and the mean percent of CD4+ T cells in each division was presented (A). Statistical significance between groups (control and infected) was assessed by ANOVA. ap < 0.05 compared with untreated cells (MEDIUM) within the same group; bp < 0.05.compared with cells with other group treated by the same manner. Histogram shows unstimulated CFSE stained CD4 T cells of control mice (a) and infected with nematodes (b).