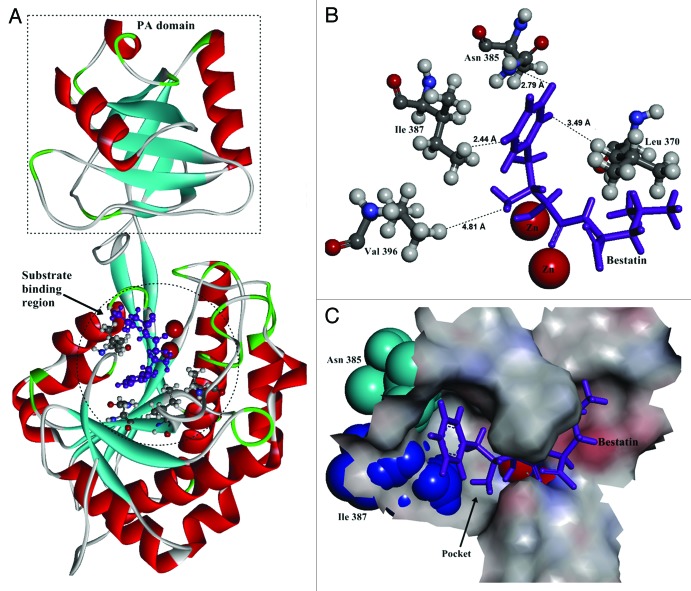
Figure 1. The structure of BSAP obtained by homology modeling. (A) Overall structure of BSAP. The α helices and β sheets are shown in red and cyan, respectively. Bestatin is shown in purple as the substrate. The PA-domain and substrate binding region are shown by dashed pane and dashed circle. (B) Local model of mutation sites in BSAP. The residues (Leu370, Asn385, Ile387, and Val396) in direct contact with the side chain of bound substrate are shown in balls and sticks, in which the oxygen atoms, nitrogen atoms, carbon atoms, and hydrogen atoms are in red, blue, deep gray, and light gray, respectively. The purple sticks indicate the bound substrate (bestatin). The two zinc atoms are shown in the form of magnified red balls. The distances (Å) from the bound substrate to the mutation sites in BSAP are shown. (C) The surface of the substrate binding region around the substrate in BSAP. The bound substrate is indicated by purple sticks. The residues Asn385 and Ile387 are displayed in the form of cyan and blue “CPK (Corey-Pauling-Koltun),” respectively. The pocket formed by the substrate binding sites is indicated by arrow.

An official website of the United States government
Here's how you know
Official websites use .gov
A
.gov website belongs to an official
government organization in the United States.
Secure .gov websites use HTTPS
A lock (
) or https:// means you've safely
connected to the .gov website. Share sensitive
information only on official, secure websites.
