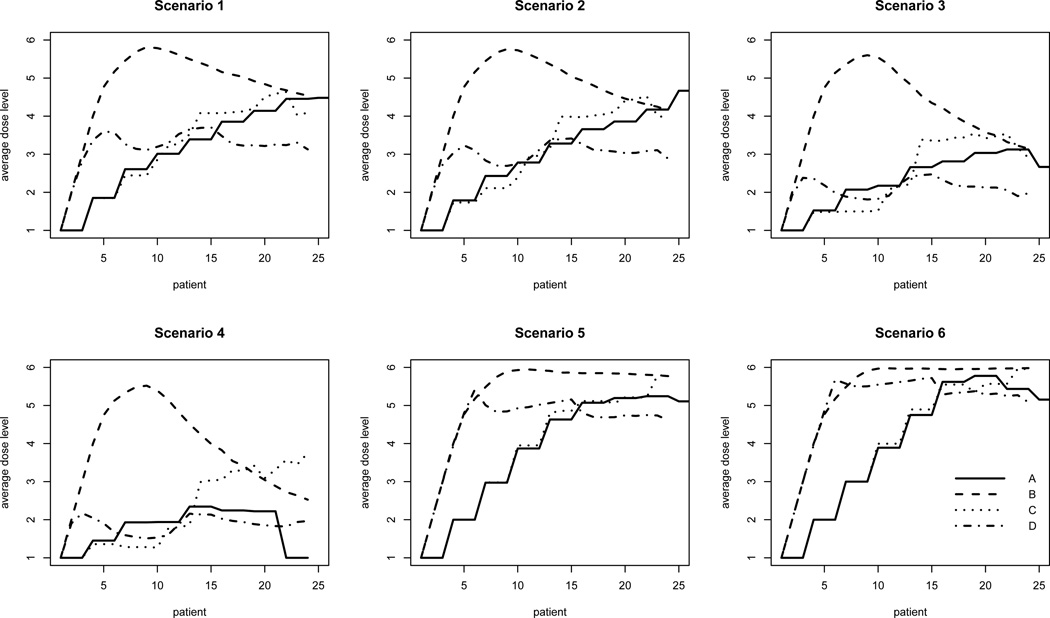
Figure 2.
Average dose level assigned over the course of the trial for each design. Dose indicated for each patient represents the mean dose based on available simulation runs. Since trials may stop before the planned maximum sample size (24) is exhausted, the mean dose may be based on fewer than 1000 simulations.

