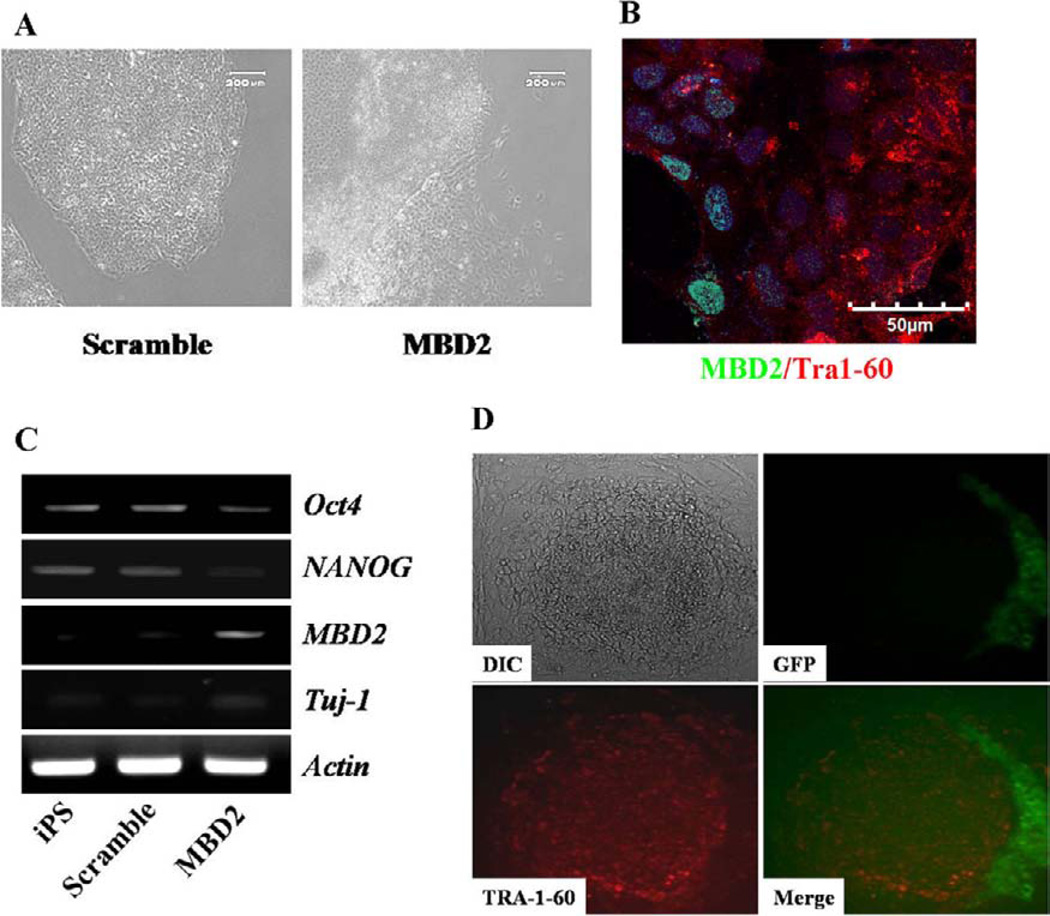
Figure 6.
Overexpression of MBD2 in fully reprogrammed iPS cells results in loss of undifferentiated iPS characteristics and overexpression of NANOG in partially reprogrammed cells converts them to cells possessing characteristics of fully reprogrammed iPS cells. (A): Fully reprogrammed iPS cells transduced with scramble control or MBD2 overexpressing constructs. Live cell immunofluorescence imaging indicated while scramble control transduced cells exhibited undifferentiated iPS colony morphology (left panel). MBD2 overexpressing cells lose undifferentiated iPS colony morphology (right panel). Representative micrographs are from three independent experiments (scale bar = 200 µm). (B): Immunoflu-orescence imaging indicated that MBD2 overexpressing cells exhibit loss of TRA-1-60 expression. (C): Gene expression analysis in uninfected control iPS cells, scramble control-infected iPS cells, and MBD2 overexpressing construct-infected iPS cells exhibited decreased NANOG and OCT4 expression in MBD2 overexpressing cells compared to uninfected control and scramble control treated iPS cells. (D): Live cell immunoflu-orescence imaging indicated partially reprogrammed colonies transduced with NANOG overexpression construct exhibited fully reprogrammed iPS colony morphology (top left panel) with significant loss in transgene expression (top right panel) and upregulation in TRA-1-60 expression. Bottom left panel is indicating TRA-1-60 expression and bottom right panel is a merged image of TRA-1-60 and EGFP expression. Micrographs are representative of three independent experiments. Abbreviations: GFP, green fluorescent protein; iPS, induced pluripotent stem.

