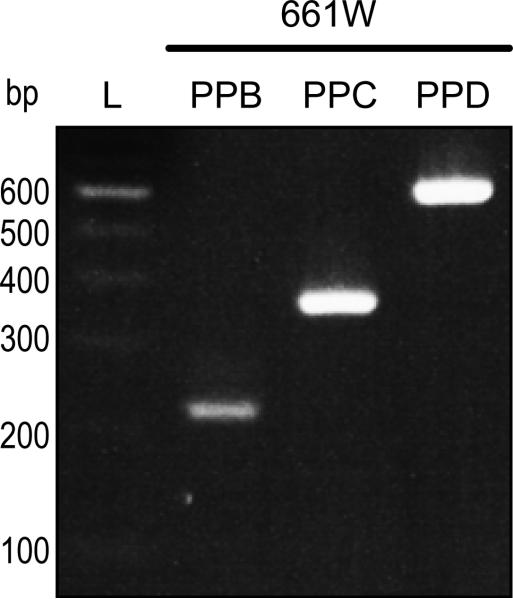
Figure 2.
RT-PCR of Pnpla2 transcript from 661W cells. Amplification of Pnpla2 cDNA from 661W cells using PPB, C, or D was performed as in methods. PCR products were diluted 1:10 and resolved by 2% agarose E-gel electrophoresis. DNA was stained with ethidium bromide. Photograph of the UV exposed gels is shown. Numbers on left indicate migration pattern of DNA ladder (L). Primer pairs used for each PCR product are indicated at the top. See Table 1 for expected product sizes.

