Figure 4.
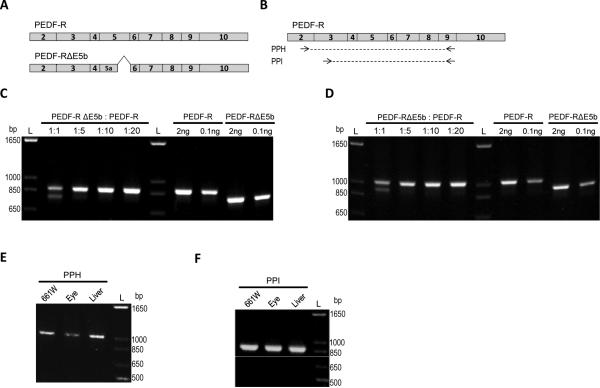
Detection limits of low abundant transcripts. A) Schematic of the open reading frame of full-length human PNPLA2 cDNA (PEDF-R) or a PNPLA2 cDNA lacking E5b (PEDF-RΔE5B) expression plasmid. B) Location of primer pairs (PP) H and I on the full-length human Pnpla2 transcript. The location for the primer pairs on the mouse Pnpla2 transcript are in Figure 1B, 1C and 1D) The plasmids were mixed in 1:1 (5ng each), 1:5 (2ng PEDF-RΔE5b, 8 ng PEDF-R), 1:10 (1 ng PEDF-RΔE5b, 9 ng PEDF-R), or 1:20 (0.5 ng PEDFRΔE5b, 9.5 ng PEDF-R) molar ratios prior to PCR amplification with PPH (C) or PPI (D). Also shown is amplification with specified amounts (0.1 or 2 ng) of each plasmid alone with PPH or PPI. E,F) Amplification of Pnpla2 transcripts from 661W cells as well as mouse eye and liver tissues was tested with both PPH (E) and PPI (F). For C-E, PCR products were diluted 1:10, resolved by 1.2% agarose E-gel electrophoresis, and stained with ethidium bromide. Photographs of UV exposed gels are shown. Numbers indicate migration pattern of DNA ladder. See Table 1 for expected product sizes.

