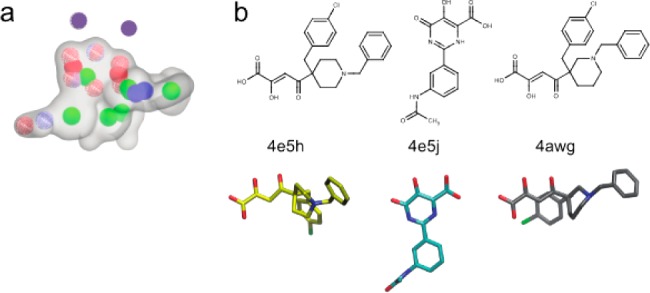
Figure 1.

(a) Best performing pharmacophore model. Model volume is represented by a transparent gray surface. Blue, red, and red/blue wire frame spheres represent hydrogen bond donors, acceptors, and acceptors/donors, respectively. Green, red, and blue spheres represent ring centers, anions, and cations, respectively. Magenta spheres (not a model element) represent the positions of the active-site metal cations. (b) Inhibitors included in the model are shown in 2- and 3-dimensional representations and labeled with their PDB IDs. The 3-dimensional representations are aligned to the pharmacophore.
