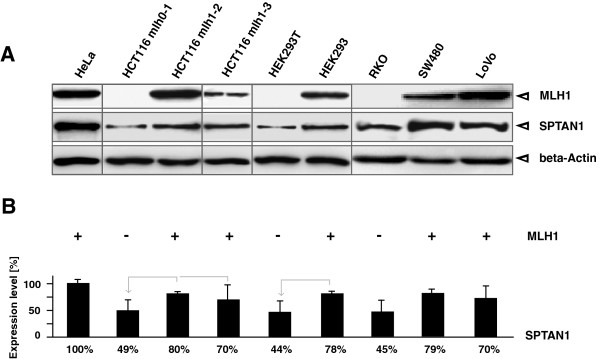
Figure 1.

MLH1 deficient cell lines show reduced SPTAN1 expression. To determine a potential influence of MLH1 on SPTAN1 expression different MLH1 proficient and MLH1 deficient cell lines were analyzed by (A) Western blotting using anti-MLH1 or anti-SPTAN1, respectively, controlled by beta-Actin detection. (B) Amounts of SPTAN1 were assessed by measuring the signal intensities of protein bands with Multi Gauge V3.2 software. Graphs indicate the results (mean ± S.D.) of at least four independent experiments. Comparability was facilitated by setting SPTAN1 levels of HeLa (lane 1) as 100%. Shared identity of MLH1 proficient with MLH1 deficient sister cell lines is assigned by grey arrows.
