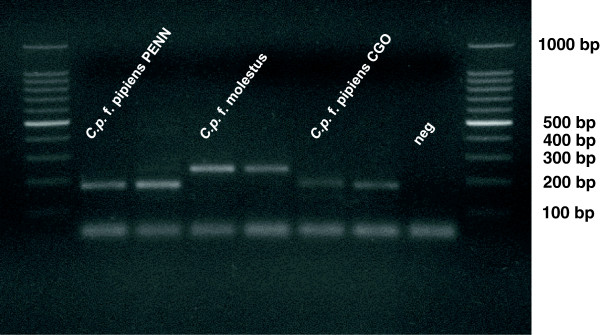
Figure 1.

Example agarose gel image confirming the ancestry of the 3 study populations of C. pipiens according to Bahnck and Fonseca [36]. Amplicons from individuals in our study populations are flanked by a DNA ladder ranging from 1000 to 100 bp. From left to right, central bands represent individuals sampled from our C.p. f. pipiens PENN (n = 2), C.p. f. molestus (n = 2), C.p. f. pipiens CGO (n = 2) populations, with a negative control.
