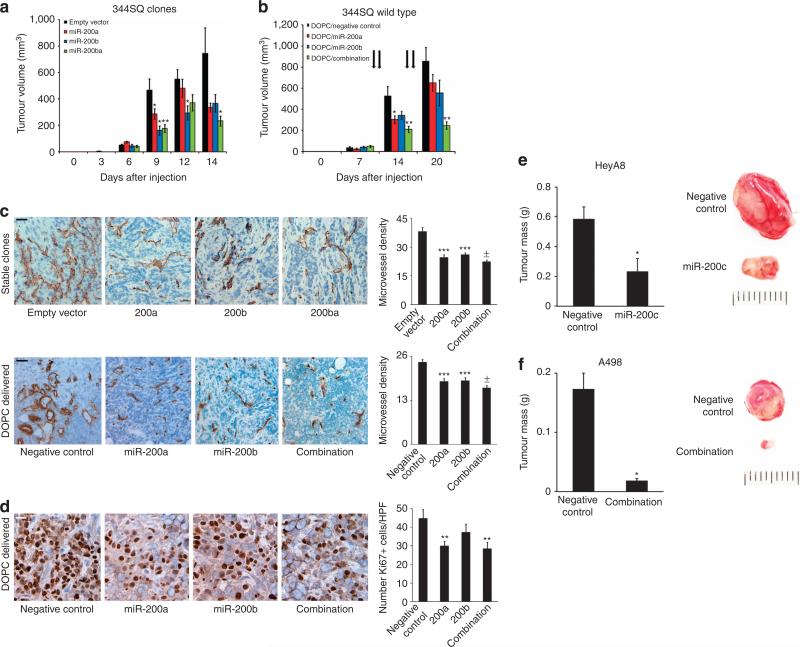
Figure 5. Effects of miR-200 delivery on angiogenesis in several cancer types.
(a) Tumour volumes in a lung cancer model of 344SQ clones, n = 10 per group (no treatment), and (b) 344SQ wild-type cells (treated with systemic miRNAs incorporated into DOPC), n = 10 per group. Data are averages ±s.e.m. P-values obtained with Student's t-test. (c) CD31 staining and microvessel density scoring for (top) stable clones or (bottom) wild-type 344SQ tumours following miRNA delivery. Bar graphs represent number of microvessels per high-powered field (hpf), n = 5 tumours per group. Scale bars, 500 μm. Data are averages ± s.e.m. P-values obtained with Student's t-test. (d) Ki-67 staining for 344SQ tumours following miRNA delivery. Bar graphs represent number of Ki-67 staining cells per hpf, n = 5 tumours per group. Scale bar, 200 μm. Data are averages ± s.e.m. P-values obtained with Student's t-test. (e) Mass of HeyA8 ovarian tumours following treatment with either control miRNA or miR-200c, and (f) mass of A498 renal tumours following treatment with control miRNA or both miR-200a and miR-200b, n = 5 per group for each experiment. Data are averages ± s.e.m. Representative tumours are shown, scale in mm. *P < 0.05, **P < 0.01, ***P < 1 × 10⁻⁵, ±P < 1 × 10⁻⁸.

