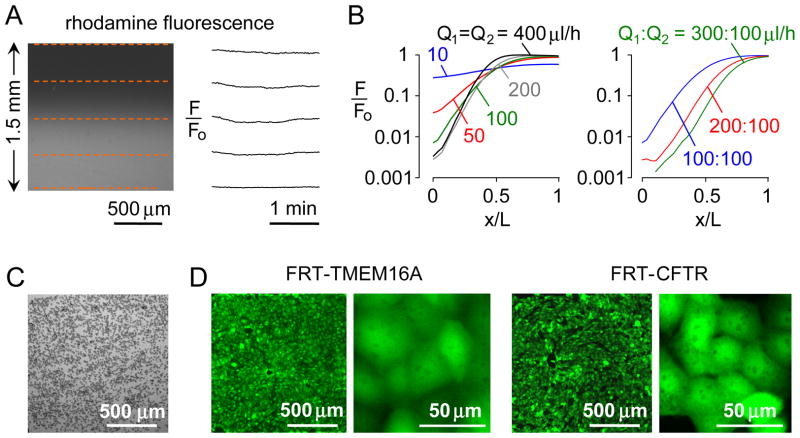
Figure 2.
Gradient generation and cell culture. A. The microfluidic chamber was perfused with water in one inlet and 5 μM rhodamine fluorescent dye in the other inlet, each at 200 μl/h. Fluorescence micrograph of 1.5 × 1.5 mm observation area (left), showing time-invariant gradient generation (F/Fo, relative fluorescence) at locations indicated by red dashed lines (right). B. Relative fluorescence across the observation area for same flow rate (Q1 = Q2) (left), and different flow rates (right). C. Brightfield micrograph just after injection of TMEM16A-expressing FRT cells (2×10⁵ cells/mL, 2×10³ cells/mm2) in the culture area. D. Fluorescence micrographs at 1 day after cultures of TMEM16A- and CFTR-expressing FRT cells shown at two magnifications.

