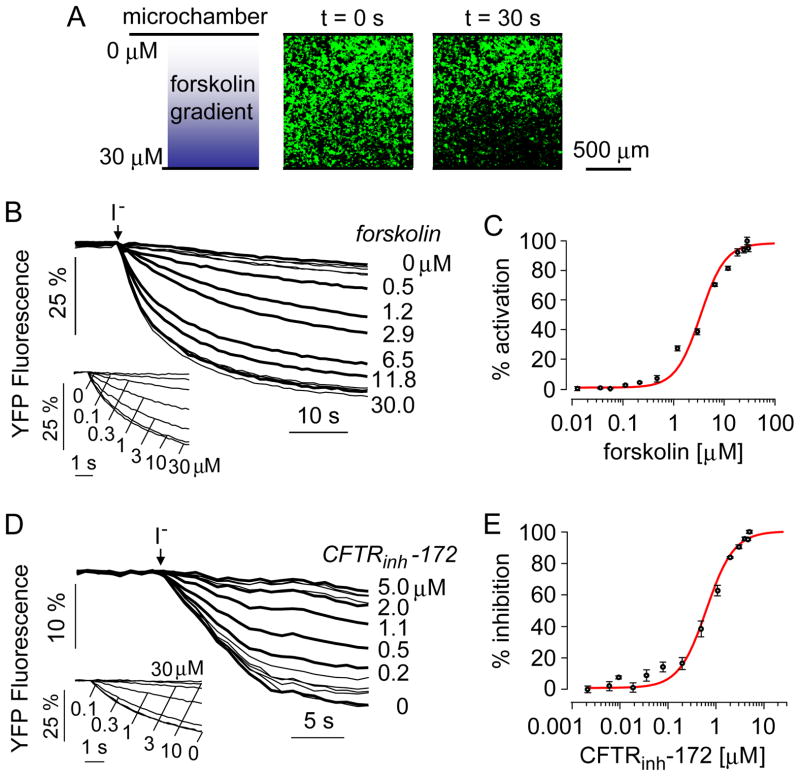
Figure 3.
Dose-response analysis of a CFTR activator (forskolin) and inhibitor (CFTRinh-172) measured in CFTR-expressing FRT cells. A. The microfluidic chamber was perfused for 10 min with PBS containing 0 or 30 μM forskolin at 600 μl/h and 200 μl/h flow rates, respectively. Gradient shown on the left and fluorescence micrographs of indicated areas on the right, measured just before and 30 s after perfusion with I− buffer. B. Time course of cellular fluorescence in different rectangular areas corresponding to indicated forskolin concentrations. Inset shows dose-response study done using a conventional platereader assay. C. Deduced single-shot dose-response with fitted IC50 of 3.2 μM and nH of 1.8. D. The microfluidic chamber was perfused for 10 min with PBS containing 0 or 5 μM CFTRinh-172, each together with 5 μM forskolin. Inset shows dose-response analysis done by platereader assay. E. Deduced single-shot dose-response with fitted IC50 of 0.65 μM and nH of 1.4.

