
Figure 5.
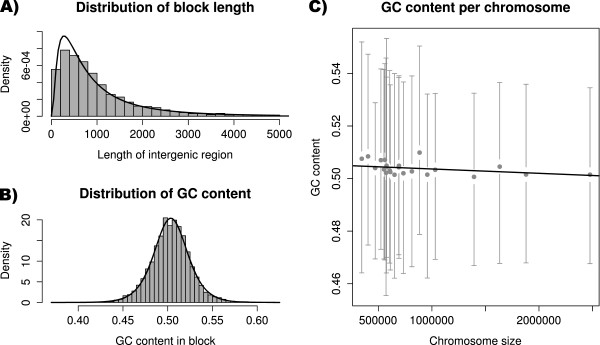
Ustilago maydis intergenic regions.A) Distribution of the length of intergenic regions in the U. maydis genome (histogram) with the corresponding fit of a log-normal distribution (solid line). B) Distribution of GC content in intergenic regions (histogram) with the corresponding fit of a logistic distribution (solid line). C) GC content plotted as a function of chromosome size. Grey points and bars represent the observed means and the 2.5 and 97.5% quantiles of the observed distributions, respectively. The solid line is the estimated regression line.