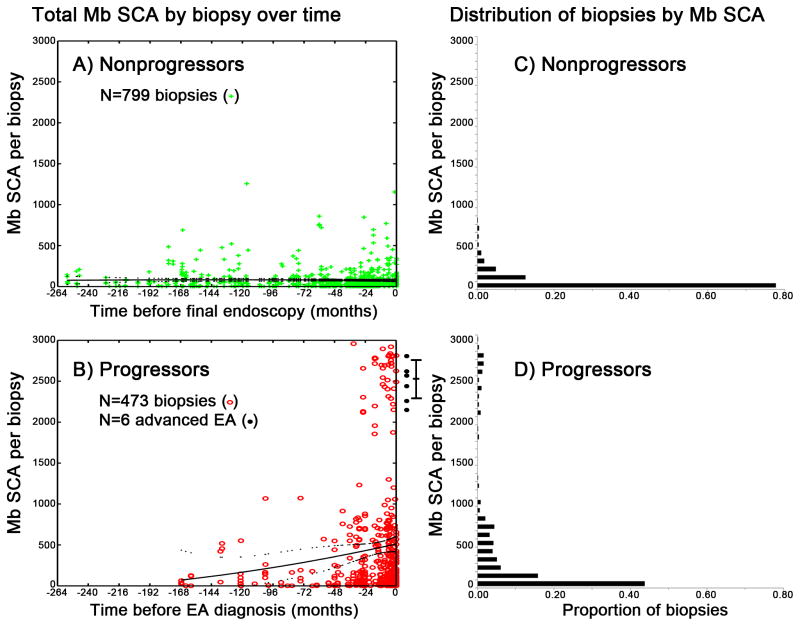
Figure 1. Total SCA dynamics in nonprogressor and progressor populations over time.
Panels A, B) Total SCA in megabases (Mb) (y-axis) per biopsies obtained at times (x-axis) before the last endoscopy in nonprogressors (Panel A) or before diagnosis of EA in progressors (Panel B. Solid black lines = trend in mean SCA, dotted black lines = 95% CI of the means fitted by quadratic polynomial regression. Six black points right of Panel B are SCA levels from advanced EA surgical resection specimens, with 95% CI of the mean. Panel C) In nonprogressors, many biopsies 105/799 (13%) have <1 Mb SCA per biopsy, and 759/799 (95%) of all nonprogressors biopsies have SCA <283 Mb, indicating that somatic genomic alterations are present in most Barrett’s biopsies but the level of SCA is generally low in nonprogressors. All 799 nonprogressors biopsies are below 1300 Mb SCA. Panel D). In contrast, only 28/473 (6%) progressor biopsies have <1 Mb SCA, and 168/473 (36%) of biopsies sampled before EA in progressors have SCA above 283 Mb (Panel D). There is a significant gap between 1300–1850 Mb, then in progressors we see 43/473 (9%) biopsies above 1850 Mb SCA, all with significant amounts of copy gain, balanced gain, and cnLOH indicative of genome doubling.

