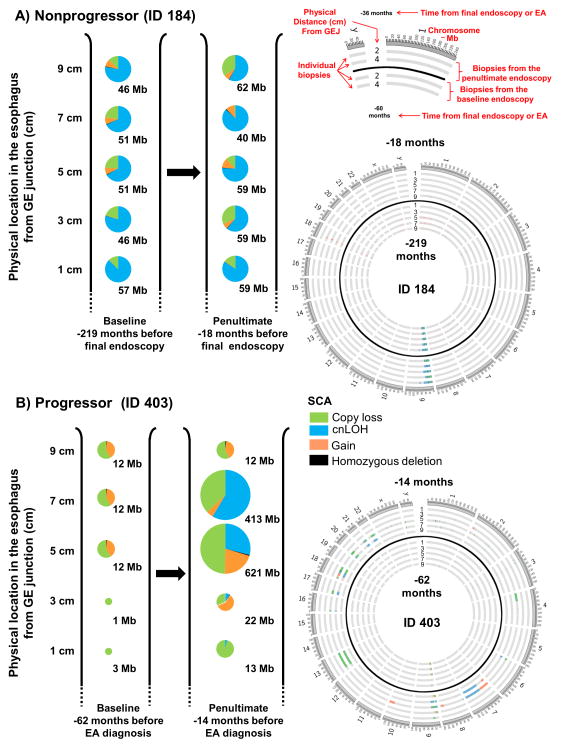
Figure 2. Proportion of different types of SCA in spatially separated biopsies over time.
SCA amount (Mb) and SCA type measured in spatially separated biopsies in two time points in a nonprogressor (Panel A) and a progressor (Panel B). At each timepoint, one biopsy is depicted as a single pie chart at each two-centimeter (cm) interval from the gastroesophageal junction (GEJ) with each pie chart showing the distribution of SCA types in each biopsy. The size of each pie chart is representational of different amounts of SCA measured in a single biopsy. A schematic is provided for interpretation of the Circos plots (66) with SCA in each biopsy at both timepoints. ID 184 shows the persistence of relatively genomically stable cell populations over a period of almost 16 years in a nonprogressing individual (Panel A). ID 403 shows the development of a cell population with significantly increased SCA during the approximately four years between the two endoscopies. Note the persistence of a cell population at the top of the figure having 12 Mb of SCA (Panel B). GEJ– gastroesophageal junction.

