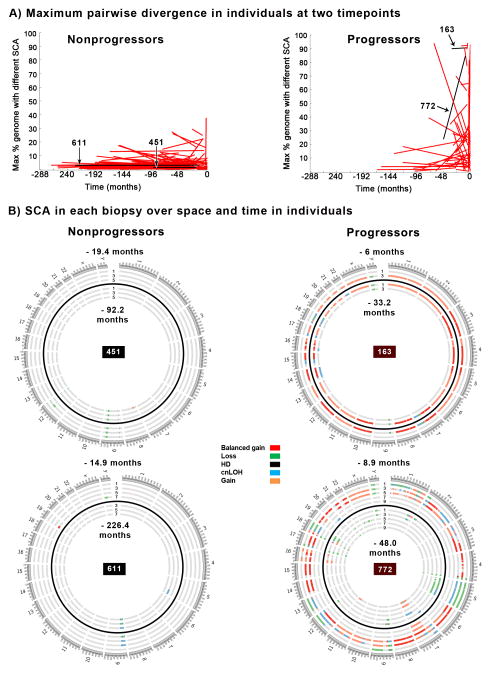
Figure 4. Individual level diversity over time.
Maximum genetic divergence of spatially separated biopsies in both endoscopies from the 104 nonprogressors and 57 progressors in whom SCA had been measured in at least two biopsies separated by two centimeters at both timepoints (Panel A). The maximum pairwise divergence between any two biopsies within the same endoscopy is plotted for the baseline and last endoscopy. Typically nonprogressors show selection of a small number of SCA events that have expanded throughout the BE segment and remain stable over long periods of time. Four patient examples are highlighted as black lines in Panel A, and and the SCA for each biopsy for these examples is shown in Panel B. Each concentric ring of the Circos plot shows the SCA for a single biopsy, with the baseline timepoint biopsies shown in the inner rings and the last endoscopy shown in the outer rings, with the two timepoints separated by a black ring. Location of each biopsy every 2 cm in the esophagus is labeled as cm from the GE junction. ID 451 and 611 are typical nonprogressors with expansion of 9p loss or cnLOH and typically 2–5 other small, sub-chromosomal or highly localized regions of SCA. In addition, the typical nonprogressor has small, random SCA events that are detected in one or a few samples but are not selected in the initial expansion and do not persist over time (e.g. ID 451, −92.2 mo, 5 cm, ch 8, and −19.4 mo, 3 cm, ch 12; ID 611 −226 mo, 5 cm, ch 5, and −14.9 mo, 7 cm, ch 19 (Panel B). Progressors with high diversity typically had samples with co-selected events that represent the punctuated stage of neoplastic evolution, and spatially localized genome doubling events such as in IDs 163 and 772 (Panel B). HD=homozygous deletion.

