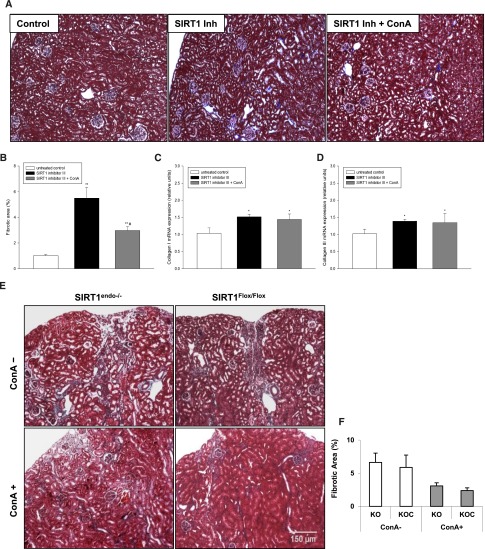
Figure 8.
Fibrotic markers in the kidneys of mice treated either with a specific SIRT1 inhibitor alone or in combination with ConA. (A) Representative Masson’s trichrome staining of kidney sections from mice treated either with SIRT1 inhibitor alone or in a combination with ConA. (B) Quantification of the fibrotic area (grid method). (C and D) Expression of collagen I and collagen III examined by real-time PCR. The animals are fed a specific SIRT1 inhibitor (SIRT1 inhibitor III) at a daily dose of 1 mg/kg body weight for 4 weeks, and the combination group receives additional weekly ConA injections at a dose of 5 mg/kg body weight. Mice with no treatment serve as the control. Data are the mean ± SEM. *P<0.05; *P<0.01; #combination group versus SIRT1 inhibitor alone; n=6 per group. (E) Representative Masson’s trichrome staining of kidney sections from SIRT1endo−/− and SIRT1Flox/Flox mice treated with either folic acid alone or in combination with ConA. (F) Quantification of the fibrotic area. Mice are injected with folic acid for 4 weeks. ConA treatment starts 1 week after folic acid injection. Data are the mean ± SEM. *P<0.05; n=5 for SIRT1endo−/−, SIRT1endo−/− with ConA, and SIRT1Flox/Flox with ConA; n=7 for SIRT1Flox/Flox. Original magnification, ×100.

