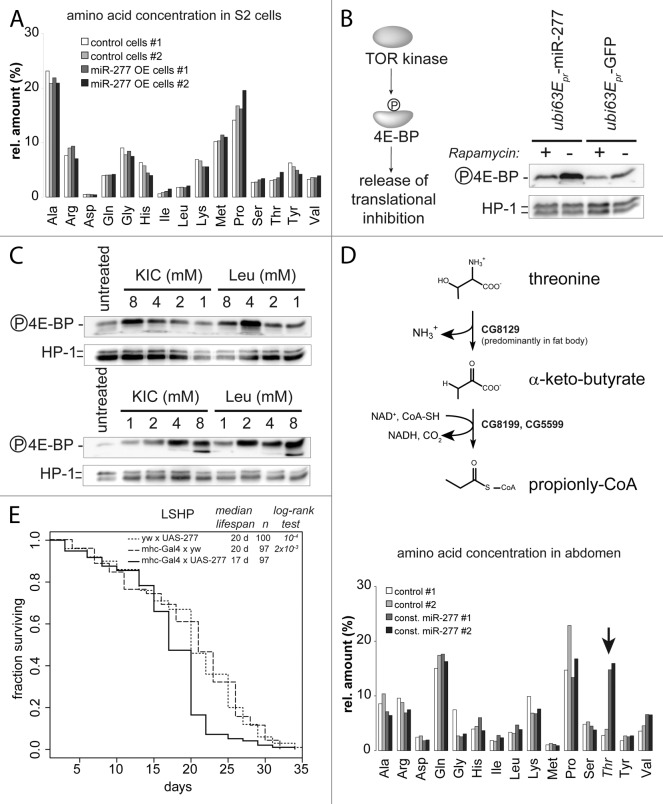
Figure 4. Activation of TOR by miR-277 likely occurs via increased KIC levels. (A) Amino acid measurement of S2-cell extracts. Control cells were transfected with a GFP expression construct instead of the miR-277 hairpin expression plasmid. To correct for small differences in extract concentration, values were normalized to the sum of all amino acid concentrations in the sample and displayed as relative proportion. (B) Detection of TOR kinase activity with an antibody specific for the phosphorylated form of the TOR substrate 4E-BP. Phosphorylation inactivates 4E-BP and releases translational inhibition. The effect of miR-277 expression on 4E-BP phosphorylation can be blunted by rapamycin, confirming that the TOR kinase is acting on 4E-BP. (C) Western blots for phosphorylated 4E-BP and HP1 as a loading control; both KIC and Leucine can activate the TOR kinase when added to the cell culture medium. The two blots show independent experiments to illustrate that the apparent maximal phospho-4E-BP levels at 4 mM KIC or Leu are within the experimental variation. (D) Upper panel: schematic representation of the threonine degradation pathway via threonine-ammonia-lyase that produced α-keto-butyrate, an alternative substrate of the BCKDH complex that is repressed by miR-277. Lower panel, the Drosophila homolog of threonine ammonia lyase is predominantly expressed in fat body and the spermatheca but absent in S2-cells. Increased threonine levels in female abdomen in response to constitutive miR-277 expression indicate that the BCKDH complex is indeed less active. (F) Muscle-specific transgenic expression of miR-277 is sufficient to shorten lifespan. While neither the driver transgene (the myosin heavy chain promotor controlling expression of the Gal4 transcription factor) nor the UAS-mir277 construct alone show abnormal lifespan, a combination of both leads to lifespan shortening on medium with an excess of protein over sugar (LSHP). The p values for the log-rank test between either of the controls and the mhc-gal4 × UAS-277 survival curve are indicated in the graph. There was no significant differences between the two control curves (p = 0.352, log-rank test).

An official website of the United States government
Here's how you know
Official websites use .gov
A
.gov website belongs to an official
government organization in the United States.
Secure .gov websites use HTTPS
A lock (
) or https:// means you've safely
connected to the .gov website. Share sensitive
information only on official, secure websites.
