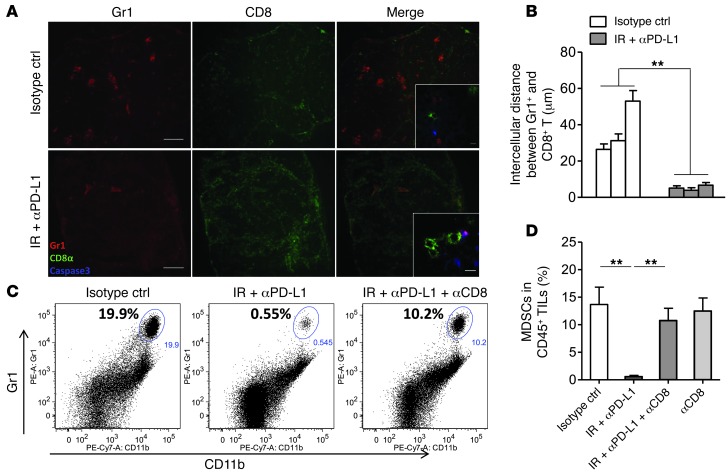
Figure 5. CD8+ T cells mediate the reduction of MDSCs in IR and anti–PD-L1 combination treatment.
TUBO tumor–bearing mice were treated with IR and antibodies as described in Figure 2A and Figure 3A. Ten days after IR, the tumors were removed. (A) Immunofluorescence staining of frozen tumor sections. Top row, untreated tumor; Bottom row, tumor treated with IR and anti–PD-L1. Scale bars: 100 μm; original magnification, ×4. Inset scale bars: 5 μm; original magnification, ×100. (B) Quantification of distance from CD11b+Gr1+ cells to the closest CD8+ T cell in a high-power field (×40). Fifteen to eighteen high-power fields were counted for each section. **P < 0.01. Sections were obtained from three tumors per group. The quantification performed on the individual tumor from each group is shown in each histogram. (C) Representative dot plots of MDSCs gated on a CD45+ cell population. (D) The reduction of the proportion of MDSCs with combination therapy was rescued after the depletion of CD8+ T cells. **P < 0.01. Representative data are shown from two (A–D) experiments conducted with 3 (A and B) or 4 (C and D) mice per group.

