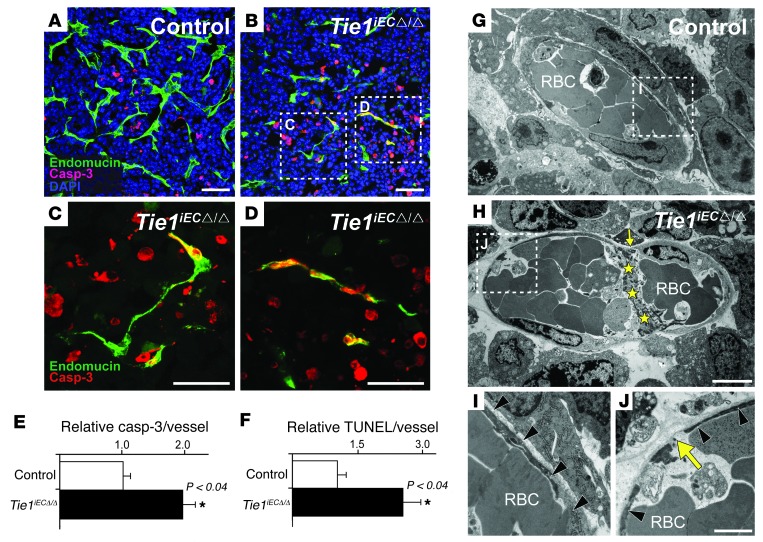
Figure 3. Endothelial Tie1 deficiency increases endothelial cell apoptosis in tumor blood vessels.
(A and B) Endomucin (green), caspase-3 (red), and nuclear (blue) staining. (C and D) Higher-magnification views of boxed regions in B. (E) Quantification of caspase-3/endomucin and (F) TUNEL/endomucin double-positive endothelial cells per tumor vessel. (G–J) TEM of control and Tie1iECΔ/Δ tumor blood vessels. (I and J) Higher-magnification views of boxed regions in G and H. Black arrowheads denote continuous endothelial cell layer; yellow arrows denote sites where no endothelial cell is apparent; yellow stars denote fibrin. RBC, red blood cell. Scale bars: 50 μm (A–D); 5 μm (G and H); 2 μm (I and J). Error bars denote SEM. Significant differences are shown by asterisks, with P values indicated.

