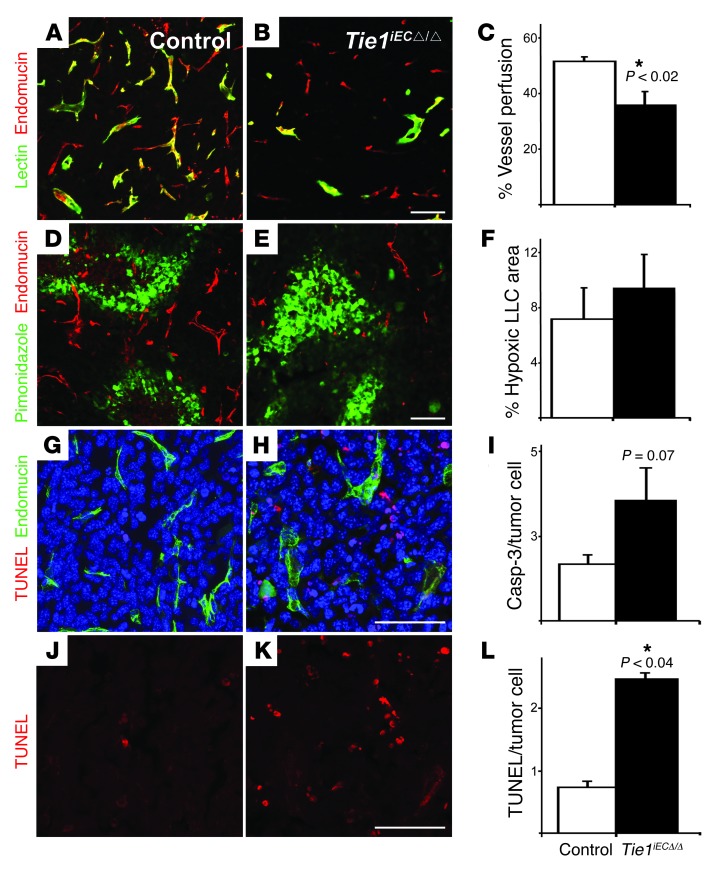
Figure 4. Vessel perfusion, hypoxia, and apoptosis in tumors of control and Tie1iECΔ/Δ mice.
(A and B) LLC tumor sections from mice injected i.v. with biotinylated L. esculentum lectin 10 minutes before tumor excision at day 18 after tumor cell implantation. Lectin (green) staining marks functional tumor blood vessels. (C) Vessel perfusion, determined as percent of lectin-positive area relative to percent of endomucin-positive area per field. n = 3–6 tumors/genotype (Pdgfb-icre/ERT2 deletor). (D and E) LLC tumor sections from mice injected i.p. with pimonidazole (hypoxia marker) 1.5 hours before tumor excision. Pimonidazole (green) staining marks the hypoxic area. (F) Percent hypoxic area relative to total field area. n = 9 tumors/genotype (both Cdh5(PAC)-cre/ERT2 and Pdgfb-icre/ERT2 deletors). Note the trend toward increased hypoxia in Tie1iECΔ/Δ tumors. (G and H) Staining for TUNEL (red), endomucin (green), and DAPI (blue). (J and K) TUNEL staining alone from G and H, shown for better visualization. (I and L) Tumor cell apoptosis indices, calculated as ratio of (I) cleaved Caspase-3 and (L) TUNEL fluorescent cells to total DAPI-positive tumor cells per field. n = 3–6 tumors/genotype (both Cdh5(PAC)-cre/ERT2 and Pdgfb-icre/ERT2 deletors). Scale bars: 100 μm. Error bars denote SEM. Significant differences are shown by asterisks, with P values indicated.

