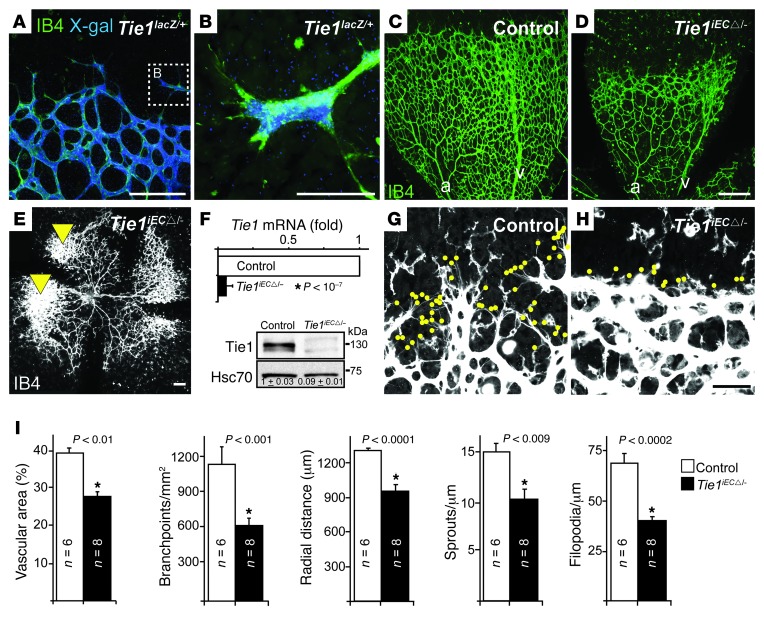
Figure 6. Endothelial Tie1 deficiency inhibits postnatal retinal angiogenesis.
(A) β-galactosidase staining of a Tie1lacZ/+ retina at P6. (B) A Tie1-expressing tip cell. (C–E) IB4–stained P6 retinas. a, arteriole; v, venule. Arrowheads denote vascular tufts. (F) Quantitative RT-PCR and Western blot of lungs from control and Tie1iECΔ/– (Cdh5(PAC)-cre/ERT2 and Pdgfb-icre/ERT2 deletors) P6 pups. Numbers denote mean densitometric readouts of relative Tie1 levels. n = 3–4 lungs/genotype. (G and H) High-magnification images of the angiogenic front. Dots denote filopodia. (I) Quantification of vascular area, branchpoints, radial distance from optic nerve, sprouts, and filopodia. Scale bars: 100 μm (A, C–E, G, and H); 50 μm (B). Error bars denote SEM. Significant differences are shown by asterisks, with P values indicated.

