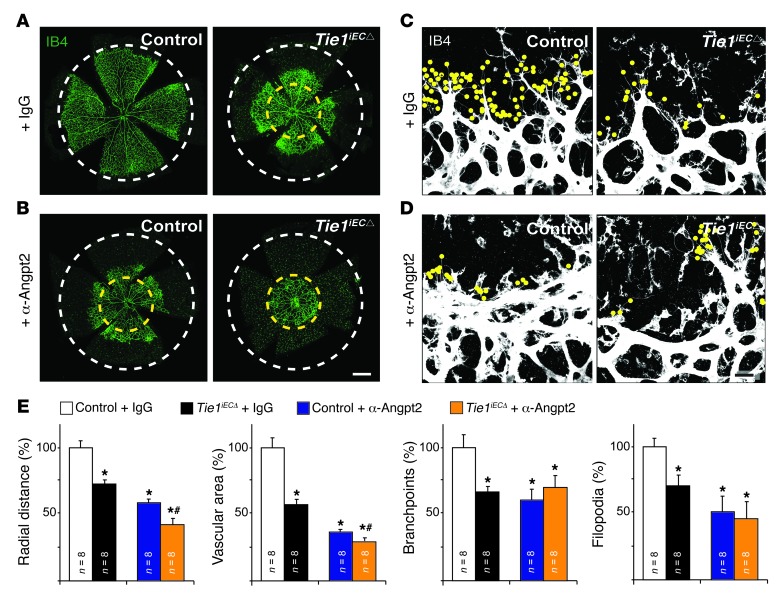
Figure 8. Combinatorial targeting of Tie1 and Angpt2 results in greater inhibition of retinal angiogenesis than targeting either alone.
(A and B) IB4-stained retinas from control and either Tie1iECΔ/Δ or Tie1iECΔ/– (Tie1iECΔ) P5 pups treated with (A) human IgG isotype (IgG) or (B) anti-Angpt2 antibodies. White dashed circles denote average control angiogenic front; yellow dashed circles denote average anti-Angpt2–treated Tie1iECΔ angiogenic front. (C and D) High-magnification images of the angiogenic front. Dots denote filopodia. (E) Radial distance from optic nerve, vascular area, branchpoints, and filopodia (expressed as a percentage of IgG-treated control). Scale bars: 100 μm. Error bars denote SEM. *P < 0.05 versus control plus IgG; #P < 0.05 versus control plus anti-Angpt2.

