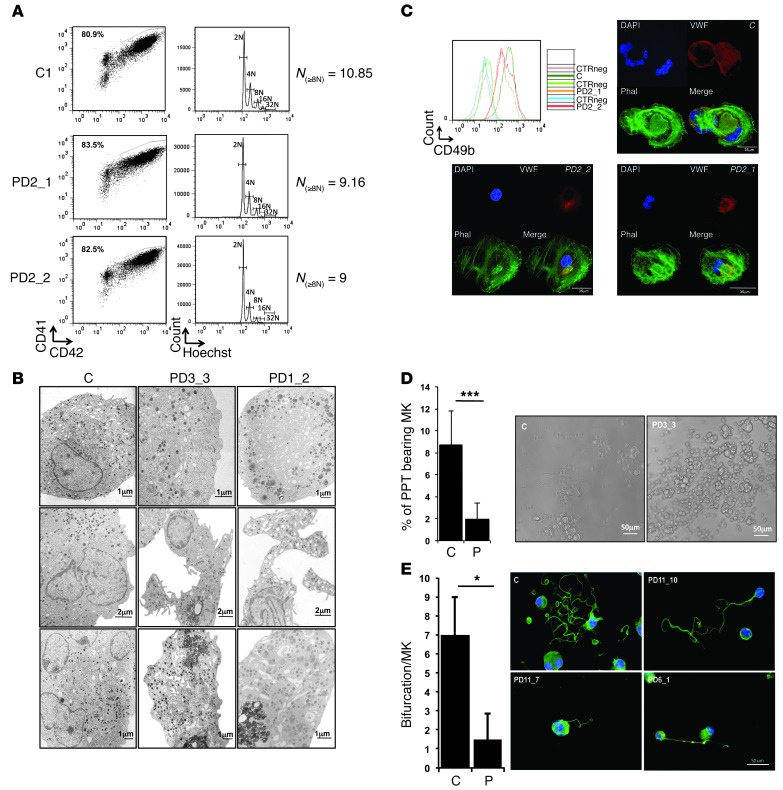
Figure 4. In vitro–derived MK differentiation of THC2 patients.
MK differentiation was induced from control or patient peripheral blood CD34+ (A–D) or CD45+ progenitors (D and E) and analyzed respectively at day 10 and day 14 of culture. (A) Gates represent mature (CD41+CD42+) MKs (left panel). The ploidy level (N) was analyzed in the gate of CD41+CD42+ MKs and was based on the percentage of cells in 8N, 16N, and 32N gates. (B) Gallery of electron micrographs showing MKs from 1 control (C) and 2 patients (PD3_3, and PD1_2). (C) Expression level of CD49b (integrin α2) on the surface of CD41+CD42+ MKs of 1 control and 2 patients (PD2_1 and PD2_2). CTRneg corresponds to the CD49b staining on the CD41–CD42– cell population for each sample. The pictures show the MKs forming stress fibers after adhesion on collagen type 1. Nucleus staining (DAPI) is in blue, phalloidin (Phal) in green and vWF in red colors. (D) The percentage of PPT-forming MKs was estimated by counting MKs exhibiting 1 or more cytoplasmic processes with areas of constriction shown on the picture at the right. Data represent mean ± SD for 14 controls and for 20 THC2 patients (P). ***P < 0.001, Student’s t test. (E) Analysis of branching area in control and patients of PPT-forming MKs after adhesion on fibrinogen and staining with anti–α-tubulin Ab (green) and DAPI (blue). The number of bifurcation was counted for each PPT-forming MK in a total of 100 MKs. Data represent mean ± SD obtained for 10 controls and 17 THC2 patients. *P < 0.05, Student’s t test.

