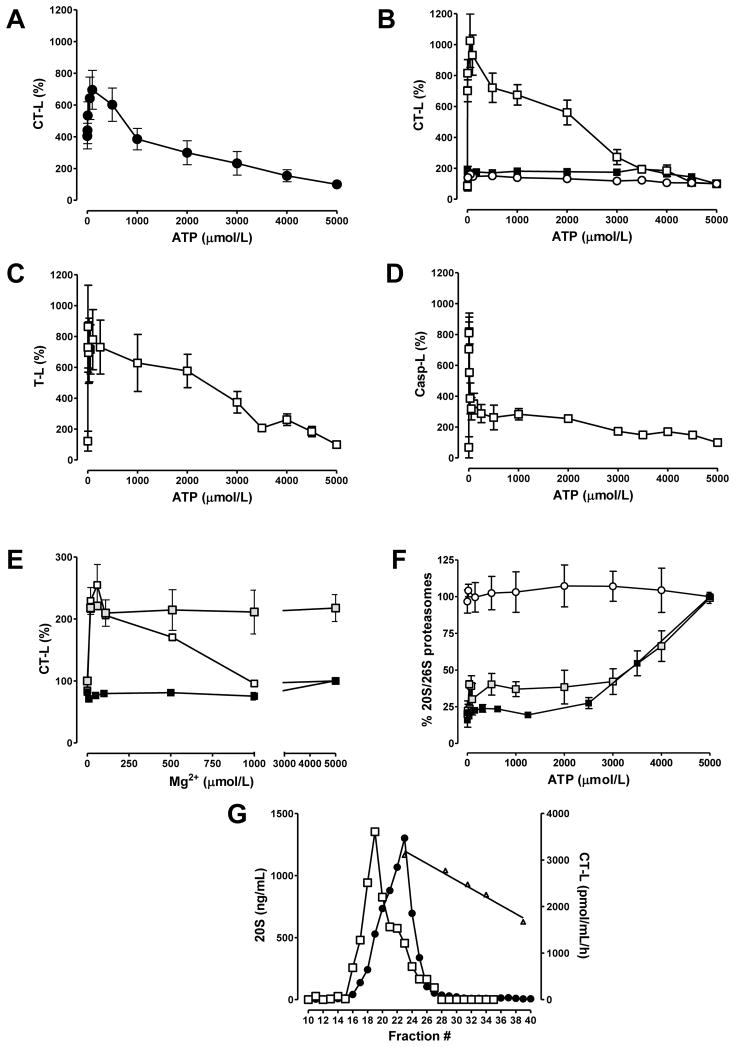
Fig. 2.
A–D: Activities are expressed as % of activity measured at the normal myocardial ATP concentration (5mmol/L=100%); n=5. Mg2+ was constant (5mmol/L) in all assays. A: ATP dependency of the proteasome CT-L activity in extracts from non-ischemic hearts. Hearts were harvested without cardioplegic arrest; n=5. B–D: ATP dependency of proteasome CT-L (B), T-L (C) and Casp-L (D) activity in highly purified proteasome preparations. □:26S; ■:20S; ○:26S, activity measurements in the presence of 5mmol/L EDTA. Activity measurements at 0mmol/L ATP were performed in the presence of 5mmol/L EDTA without addition of ATP to the incubation mixtures (the total ATP concentration in these incubation mixtures containing 26S was 8 μmol/L and derived from the stock 26S solution). E: Mg2+ dependency of the CT-L proteasome activity. □:26S, 2mmol/L ATP;  :26S, 20 μmol/L ATP; ■: 20S, 2mmol/L ATP. Data are % of activity measured at 5mmol/L Mg2+, 2mmol/L ATP. Activity measurements at 0mmol/L Mg2+ were performed in the presence of 5mmol/L EDTA. F: Measurement of 20S and 26S content by ELISA. 160–500 ng of 20S or 26S were loaded onto the ELISA plate at the given ATP concentrations and 0 or 5mmol/L Mg2+, and incubated for 2h. For all subsequent steps, ATP/Mg2+ was kept constant at 5mmol/L. Data are expressed as % of proteasome content when assayed at 5mmol/L ATP and Mg2+; n=5–7. ○:20S measured with the 20S ELISA. ■:26S measured with the 26S ELISA; 0mmol/L Mg2+.
  :26S measured with the 26S ELISA; 5mmol/L Mg2+. G: Gel filtration of 26S on Superose6. The running buffer contained 50 μmol/L ATP, 5mmol/L Mg2+. Fractions were analyzed for 20S content by ELISA (●) and proteasome CT-L activity (□; incubation mixtures contained 50 μmol/L ATP and 5mmol/L Mg2+). △: elution positions of molecular mass standards. The line shows the standard curve derived from linear regression analysis (r2=0.98).

