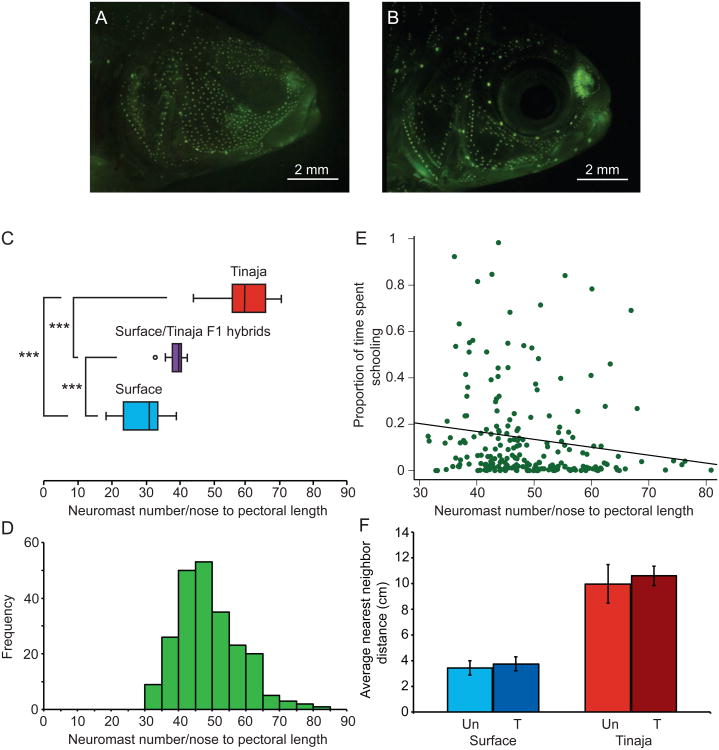
Figure 2. Relationship between schooling behavior and the lateral line system.
A. Cranial neuromasts in a Tinaja cavefish. B. Cranial neuromasts in a surface fish. Neuromasts are visualized using DASPEI. C. Distribution of cranial neuromast number corrected for size in surface fish (n=21), surface/Tinaja F1 hybrid fish (n=7), and Tinaja fish (n=21). D. Distribution of cranial neuromast number corrected for size in the F2 population (n=227). E. Proportion of the time spent schooling as a function of number of cranial neuromasts corrected for size in the F2 population (n=214). F. Nearest neighbor distances (in centimeters) in groups of surface (n=6) and Tinaja cavefish (n=6) treated with 0.002% gentamicin (T) or untreated (Un). *p<0.05, **p<0.01, ***p<0.001.

