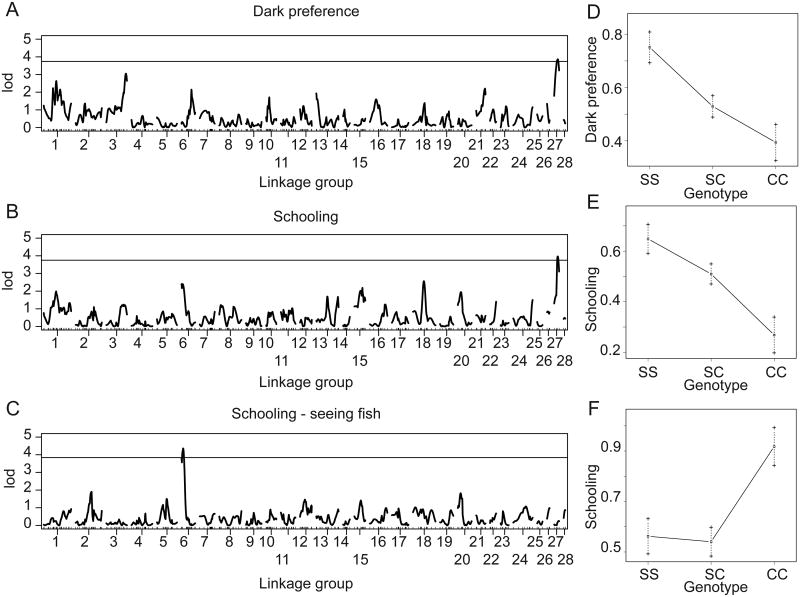
Figure 6. Visual and non-visual QTL for evolutionary loss of the tendency to school in cavefish.
A. Linkage map derived from SNPs in a Tinaja/Surface intercross. B. QTL for a binary measure of dark preference (n=267) where fish spending greater than 200 seconds were scored as preferring the dark. The line indicates a significant LOD score for a p-value < 0.05. C. QTL for a binary measure of the tendency to follow the model school (n=276). Fish were scored as schooling if they spent more than 5% of their time following the model on average. The line indicates a genome-wide significance LOD score for a p-value < 0.05. D. QTL for a binary measure of the tendency to follow the model school for the subset of fish that preferred the dark (n=143). E. Effect plot for the QTL for dark preference measured as a binary of time the dark (1=preferring the dark, 0=no dark preference). F. Effect plot for the QTL for schooling, measured as proportion of time following the model schooling and then made into a binary trait (1=schooling, 0=non-schooling). G. Effect plot for the schooling QTL in light-responsive fish, measured as proportion of time following the model schooling and then made into a binary trait (1=schooling, 0=non-schooling). Genotypes are for homozygous surface (SS), heterozygous (SC) or homozygous cave (CC) alleles.

