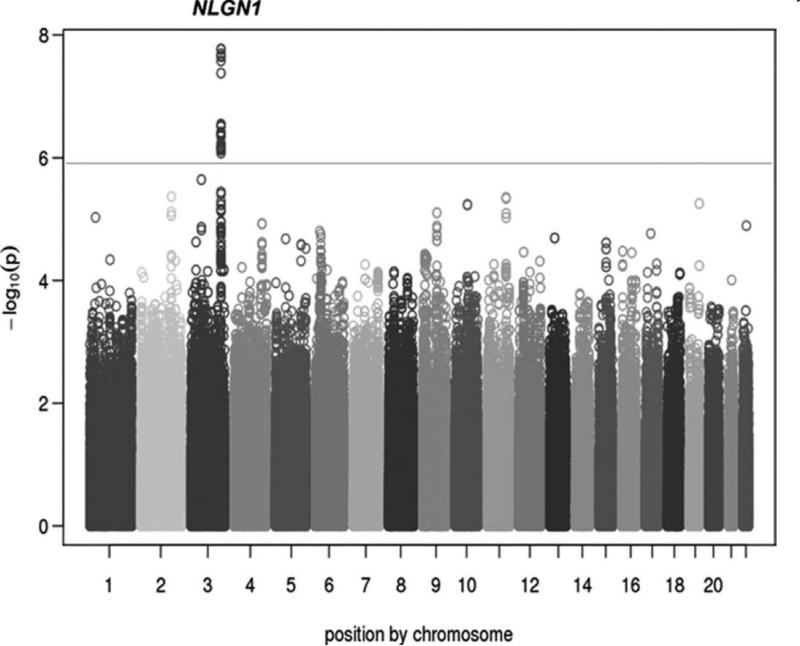
Figure 1.
Genome-wide Manhattan plot for the ASCOT Anglo IR-UK GWAS showing a cluster of 17 SNPs in/near NLGN1 associated with BP variability (P < 5 × 10⁻⁷). Individual –log10 p values are plotted against their genomic position by chromosome. The dotted line at 10−6 marks the threshold for promising SNPs and the solid line at 10−8 marks the genome-wide significance threshold.

