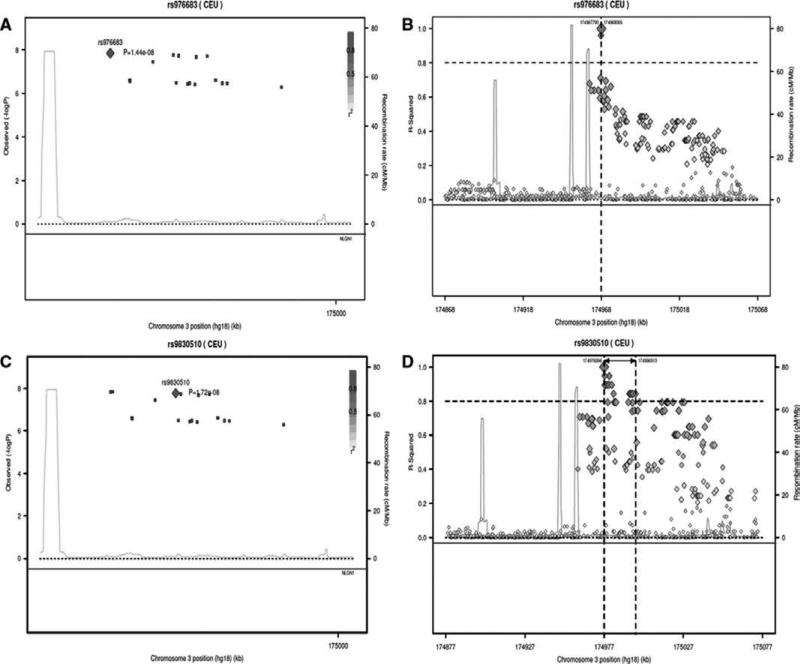
Figure 2.
Regional association and LD plots for the 17 correlated SNP's within the Neuroligin-1 (NLGN1) gene (3q26.31). The plots A & B are conditioned on the imputed sentinel SNP rs976683 and C & D are conditioned on the top genotyped SNP rs9830510. In plot 2A & C, each coloured square represents a SNP p value, with the colour scale correlating the r2 values for that SNP to the target SNP (red diamond) taken from the HapMap phase 2 CEU panel. In plot 2B & C, the target SNP (orange diamond) is represented in linkage disequilibrium with the cluster of 16 SNPs and other SNPs in the HapMap phase 2 CEU panel.

