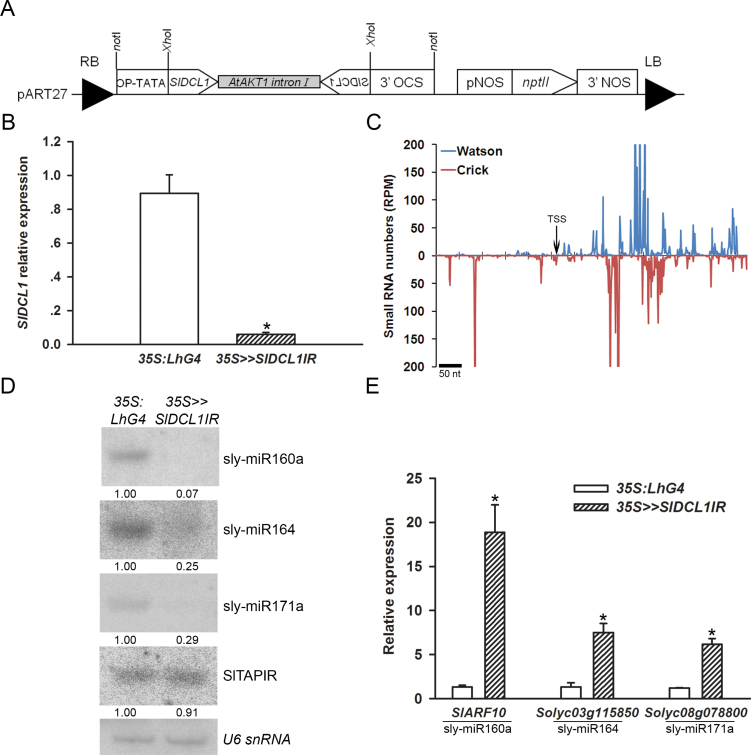
Fig. 1.
Molecular characterization of 35S>>SlDCL1IR plants. (A) Schematic representation of the binary responder SlDCL1 RNAi (pART27-OP:SlDCL1IR) construct. (B) Quantitative RT-PCR analysis of SlDCL1 transcript in 35S>>SlDCL1IR seedlings 28 d after sowing. Primers were designed around the miR162 complementary site, and TIP41 expression values were used for normalization. Data are means ±SD of three independent biological repeats, each measured in triplicate. An asterisk indicates a significant difference as determined by Student’s t-test (P ≤ 0.01). (C) Schematic of siRNA accumulation at the SlDCL1IR RNAi sequence. The siRNA sequences were determined by deep sequencing of the seedling RNA used for qRT-PCR analysis in B. The normalized abundances of siRNAs were plotted relative to the sequence used for RNAi (Supplementary Table S1 available at JXB online) as a function of the positions of their 5′ ends. Maximum normalized reads per million (RPM) were set at 200/–200 to enable the visualization of relatively low abundance siRNAs. TSS, transcription start site as determined by RACE. (D) RNA gel-blot analysis of small RNAs in the RNA samples analysed in B. The total RNA (2.5 μg) was hybridized with the indicated small RNA antisense probe. An antisense probe for U6 snRNA served as a loading control. Small RNA expression was normalized to U6 snRNA, and levels are indicated below each panel. (E) qRT-PCR analysis of miRNA target transcripts in the RNA samples analysed in B. The corresponding miRNA is shown below each target mRNA. TIP41 expression values were used for normalization. Error bars indicate ±SD of three biological replicates, each measured in triplicate. Asterisks indicate significant difference as determined by Student’s t-test (P ≤ 0.01).

