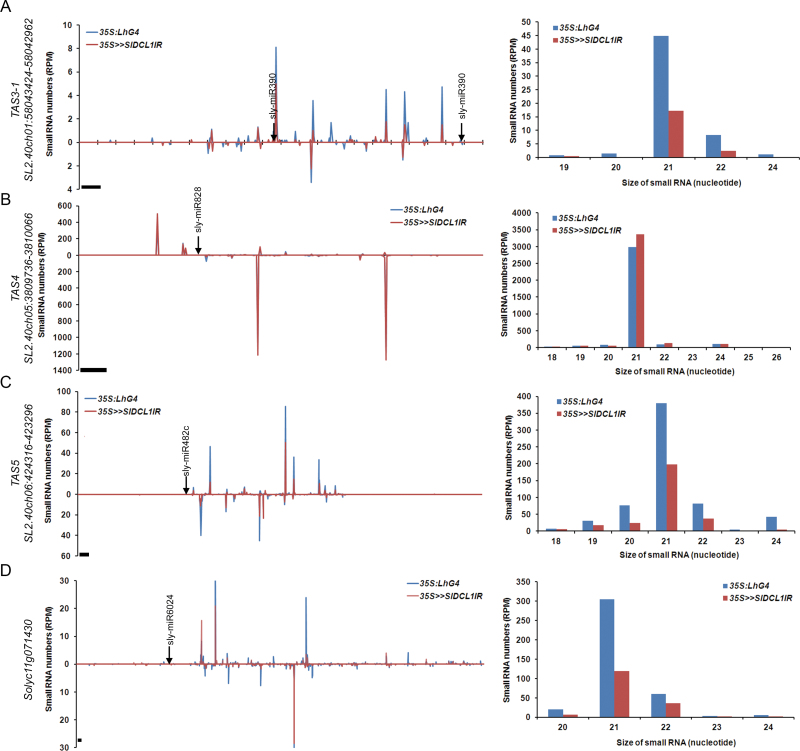
Fig. 4.
Effect of SlDCL1 silencing on phased siRNA accumulation. Schematic of 35S>>SlDCL1IR and control siRNA accumulation at indicated TAS (A–C) and R genes (D). The normalized abundances of siRNAs were plotted relative to their mRNA sequence as a function of the positions of their 5′ ends. Values above and below zero indicate siRNA matching of the plus and minus strand, respectively. The corresponding miRNA cleavage site is indicated. Bars=21 nt. Size distribution of total gene-derived siRNAs is shown on the right. Data are means of two biological replicates.

