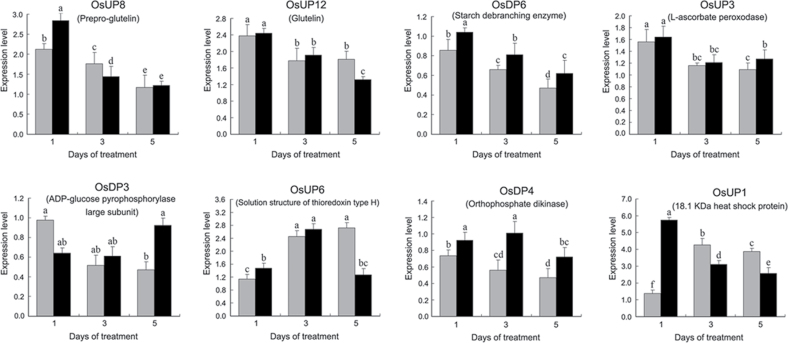
Fig. 5.
Expression of eight representative genes encoding the differentially expressed proteins as shown by real-time qRT–PCR analysis in heat-tolerant and heat-sensitive rice lines under high temperature for 1, 3, and 5 d. Rice caryopses were sampled from heat-tolerant and heat-sensitive rice lines after 1, 3, and 5 d of high temperature stress. Real-time qPCR was carried out by SYBR-green fluorescence using a 7500 Real-Time PCR Machine (Applied Biosystems). The threshold cycle (CT) values, representing the PCR cycle at which fluorescence passed the threshold, were generated using the ABI PRISM 7500 software tool. All data were normalized against the expression of the reference gene ACT1 (GenBank ID: AK100267). The relative expression levels were calculated using the comparative ΔΔCT method, and ΔΔCT= (CT, Target−CT, Actin)time X−(CCK, Target−CCK, Actin) time X. ‘Time X’ indicates 1, 3, and 5 d of high temperature stress. The mean expression values were calculated from triplicate measurements of each target gene.

