Table 1.
Identification, functional categorization, and quantitative analysis of the differentially displayed proteins
| Spot Exp. namea | Protein score | Sequence coverage (%) | Peptide matches | Exp./Theo. | Protein hits | Protein identification | Changes in spot intensityb | |
|---|---|---|---|---|---|---|---|---|
| Mol. wt (kDa) | pI | |||||||
| Biosynthesis | ||||||||
| OsUP8 | 290 | 22 | 10 | 31.7/56.9 | 6.21/8.93 | gi|218165 | Pre-pro-glutelin |
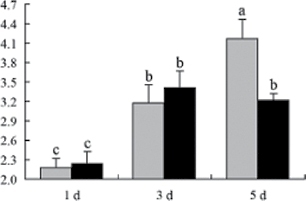
|
| OsUP12 | 610 | 26 | 11 | 40.3/56.8 | 7.01/9.17 | gi|169791 | Glutelin |
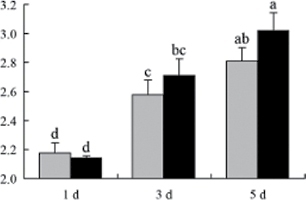
|
| OsUP13 | 138 | 16 | 6 | 53.6/54.3 | 7.79/9.30 | gi|218190412 | Glutelin |
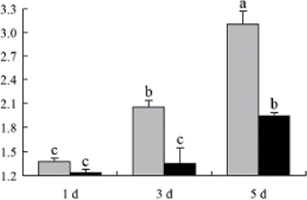
|
| OsUP14 | 283 | 31 | 9 | 23.9/57.4 | 6.71/8.96 | gi|115445979 | Glutelin |
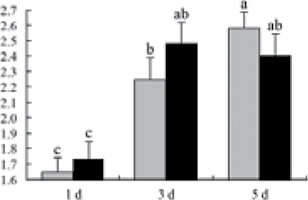
|
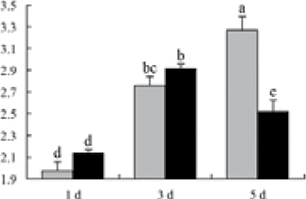
| OsUP16 | 151 | 14 | 7 | 50.4/38.8 | 5.96/5.73 | gi|22748337 | Putative gln1_oryza glutamine synthetase isozyme |
|
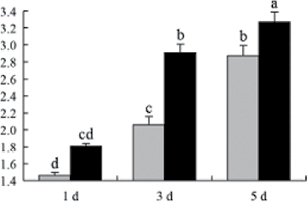
| OsUP18 | 484 | 27 | 10 | 36.2/50.7 | 6.26/8.74 | gi|213876598 | Gt3, partial |
|
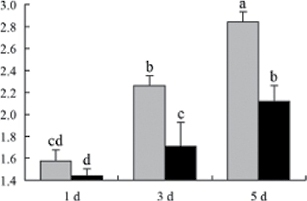
| OsDP2 | 394 | 9 | 9 | 119.3/114.1 | 6.52/6.35 | gi|218194315 | Hypothetical protein OsI_14800 (pullulanase) |
|
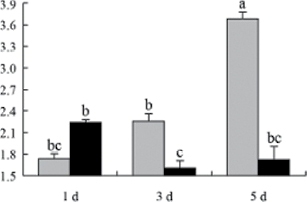
| OsDP4 | 282 | 23 | 13 | 146.7/103.6 | 5.47/5.98 | gi|115463815 | Orthophosphate dikinase |
|
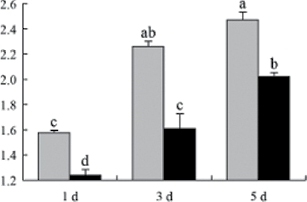
| OsDP6 | 193 | 5 | 7 | 121.1/69.5 | 6.49/6.61 | gi|115470493 | Starch debranching enzyme |
|
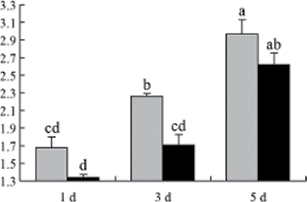
| OsDP8 | 178 | 28 | 11 | 93.4/67.0 | 6.92/8.16 | gi|19911776 | Granule-bound starch synthase |
|
| Energy metabolism | ||||||||
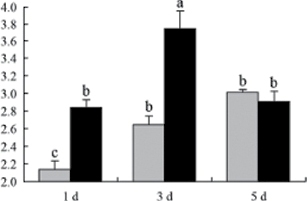
| OsUP5 | 355 | 40 | 13 | 35.9/27.4 | 5.41/5.39 | gi|125528336 | Dihydroxyacetone phosphate and d-glyceraldehyde-3-phosphate dehydrogenase |
|
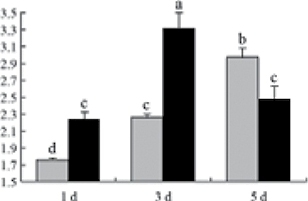
| OsUP19 | 147 | 18 | 6 | 44.2/50.1 | 6.89/5.44 | gi|115463933 | Putative GDP dissociation inhibitor |
|
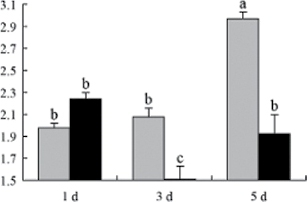
| OsDP3 | 353 | 36 | 13 | 109.4/58.3 | 5.91/5.48 | gi|115438749 | ADP-glucose pyrophosphorylase large subunit |
|
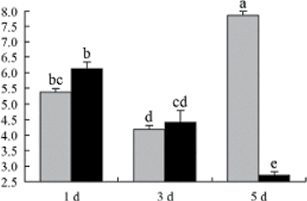
| OsDP5 | 596 | 41 | 14 | 78.4/51.8 | 5.45/5.43 | gi|115480571 | UDP-glucose pyrophosphorylase |
|
| Oxidation | ||||||||
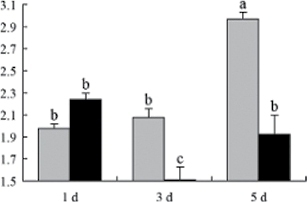
| OsUP3 | 490 | 41 | 10 | 34.2/27.3 | 5.43/5.42 | gi|115452337 | l-Ascorbate peroxidase |
|
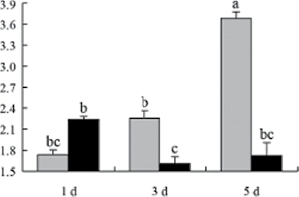
| OsUP4 | 220 | 35 | 8 | 20.7/35.6 | 5.89/8.22 | gi|115465579 | Putative malate dehydrogenase |
|
| OsUP6 | 336 | 65 | 9 | 10.4/13.3 | 5.27/5.16 | gi|115470941 | Chain A, solution structure of thioredoxin type H from Oryza sativa |
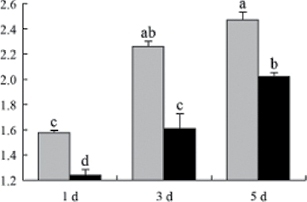
|
| OsUP7 | 265 | 53 | 8 | 127.8/15.2 | 6.50/5.92 | gi|115473931 | Copper/zinc superoxide dismutase |
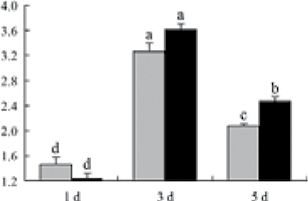
|
| OsUP10 | 459 | 50 | 12 | 33.1/27.3 | 5.54/5.42 | gi|115452337 | Ascorbate peroxidase and cytochrome c peroxidase |
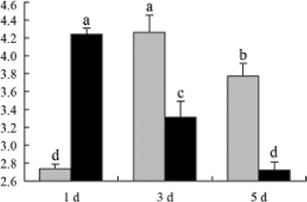
|
| OsUP11 | 318 | 32 | 10 | 44.2/35.6 | 6.89/8.22 | gi|115465579 | Putative r40c1 protein, ricin-type beta-trefoil lectin domain-like protein |
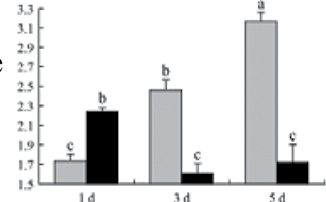
|
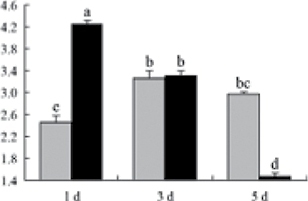
| OsUP15 | 161 | 23 | 5 | 42.5/40.0 | 5.56/7.82 | gi|115482392 | Putative conserved protein |
|
| Heat shock | ||||||||
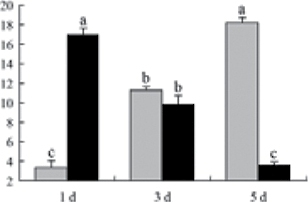
| OsUP1 | 276 | 29 | 9 | 18.2/18.1 | 5.51/4.57 | gi|115463081 | 18.1kDa heat shock protein |
|
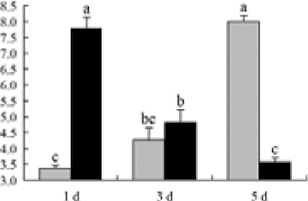
| OsUP2 | 341 | 31 | 9 | 18.0/17.9 | 5.91/5.23 | gi|18031726 | 17.9kDa heat shock protein |
|
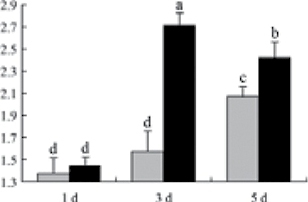
| OsDP1 | 101 | 19 | 12 | 133.4/65.2 | 6.39/6.03 | gi|115447567 | Tetratricopeptide repeat domain protein (similar to heat shock protein STI). |
|
| Transcript regulation | ||||||||
| OsUP9 | 167 | 27 | 5 | 42.5/28.5 | 5.40/5.45 | gi|115464745 | Basic/helix–loop–helix (bHLH) transcription factors |
|
a Spot experiment name corresponds to the spots in Figs 2 and 3. OsUP and OsDP indicate up- and down-regulated proteins, respectively.
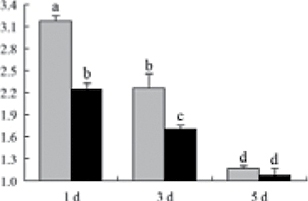
b Relative expression graphs of the protein spots after high temperature treatment in heat-sensitive and heat-tolerant rice lines. Mol. wt and pI indicate molecular weight and isoelectric point, respectively. Grey bars indicates heat-sensitive rice, and black bars indicates heat-tolerant rice. Spot volumes were analysed by Progenesis software. The fold change of up-regulated protein spot volumes was calculated by treatment/control, whereas the change fold of down-regulated protein spot volumes was calculated by control/treatment. From left to right, each bar indicates the fold change in protein spot volumes compared with control after exposure to high temperature for 1, 3, and 5 d. Values are presented as means ±SE. Error bars are from three spots in three independent gels.
