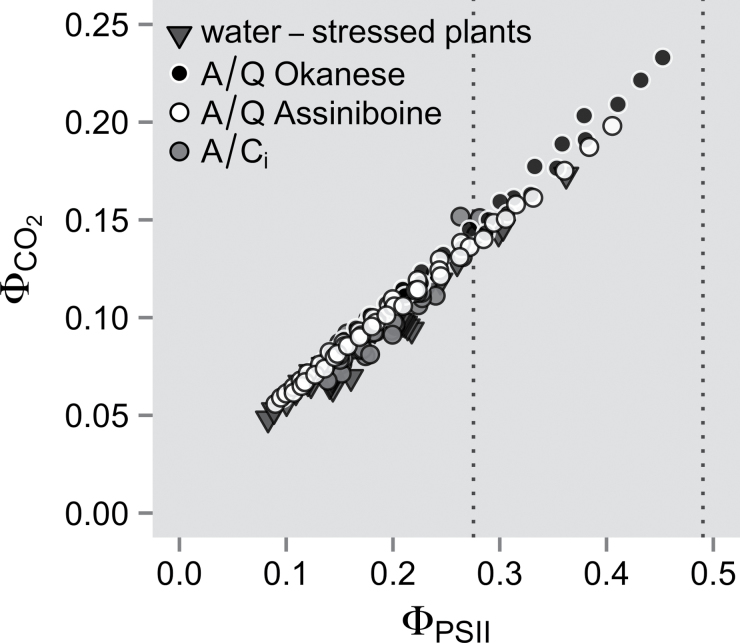
Fig. 1.
Relationship between the photochemical electron transport rate estimated from fluorescence measurements (J f) and gas exchange (J CO2) under 1% O2. Photosynthetic response curves to light (A/Q) and CO2 (A/C i) were carried out on three plants per clone, and the slope (s) and intercept of the relationship between ΦCO2 and ΦPSII were used to calibrate J f (see Equation 5). A/C i data were pooled together for clarity. Water-stressed plants were also measured and were in a similar range to well-watered plants. The dotted lines indicate the range of ΦPSII values observed during the short-term soil drying experiments (see Fig. 3). A/Q Okanese, ΦCO2=0.012+0.480×ΦPSII; A/Q Assiniboine, ΦCO2=0.016+0.450×ΦPSII; A/C i, ΦCO2=0.003+0.496×ΦPSII; water-stressed plants, ΦCO2=0.012+0.433×ΦPSII.

