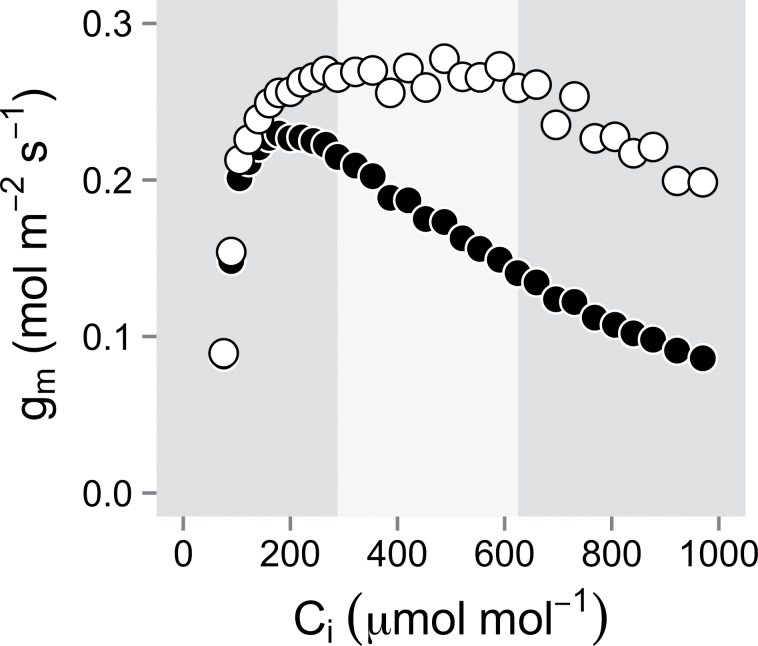
Fig. 2.
Apparent response of mesophyll conductance (g m) to intercellular CO2 mole fraction (C i) using the 1% O2 calibration method (filled circles) and the proposed 21% O2 A/C i calibration method (open circles) on one Okanese leaf. The light coloured area represents the RuBP-limited range where ΦPSII is found to be constant. Estimates of s under 1% and 21% O2 were 0.4799 and 0.4572, respectively.

