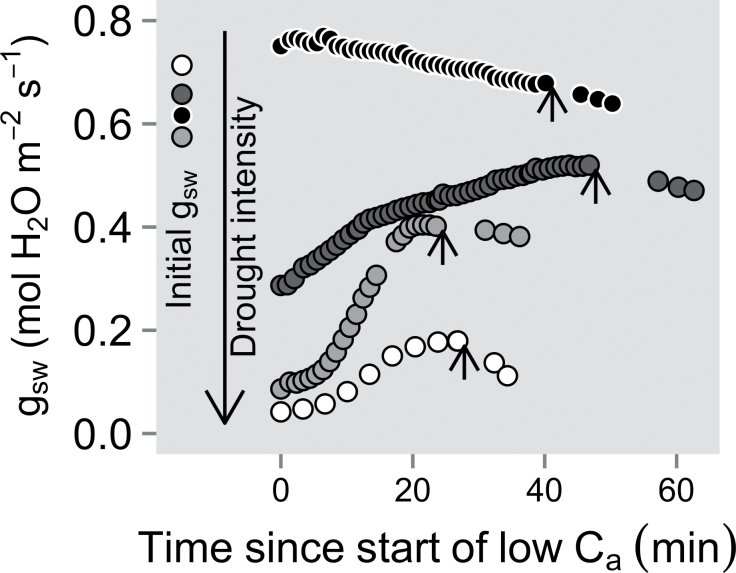
Fig. 5.
Time courses of stomatal conductance (g sw) when the upper foliage of well-watered and water-stressed Assiniboine plants was exposed to a reduction in ambient CO2 concentration (C a ~75 μmol mol–1). Different levels of water stress were examined, expressed here as the percentage of g sw relative to their initial well-watered state (g sw_ini) evaluated 7 d prior to the low C a treatment (black circles, well-watered, where g sw increased compared with g sw_ini; dark grey circles, 44% of g sw_ini; light grey circles, 15% of g sw_ini; and white circles, 6% of g sw_ini). The short arrows indicate when C a was increased from ~75 μmol mol–1 to a CO2 concentration resulting in a C i of ~275 μmol mol–1. The data points to the right of the arrows were measured at that C i, showing the high sensitivity of severely stressed plants to the return to near ambient C a.

