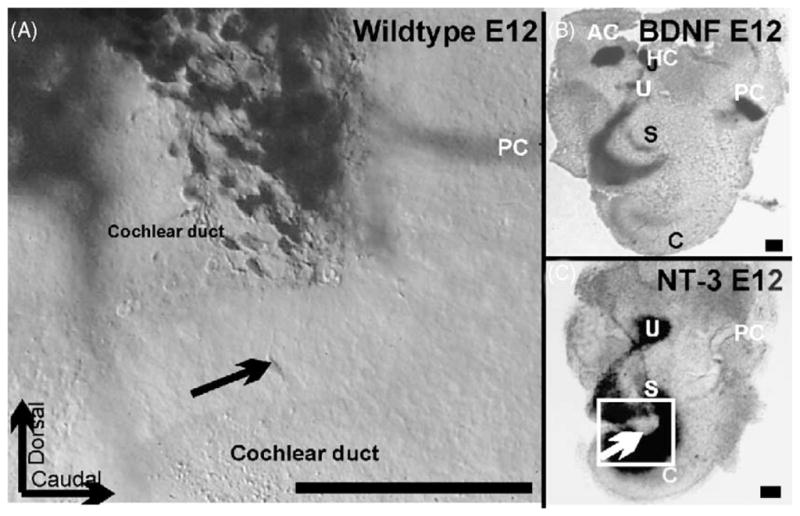
Fig. 3.

These images show the distribution of spiral primary neurons near and in the forming cochlear duct of an E12 embryo as shown by dextran amine filling from the brainstem (A) and the expression of BDNF (B) and NT-3 (C) at E12 as shown by a LacZ reporter that reveals the distribution of gene expression specific for those two genes. Arrows in A and C indicate a comparable area of the cochlear duct which shows delaminating NT-3 positive precursors that apparently can be filled from the brainstem. Bar indicates 100 μm.
