Fig. 1.
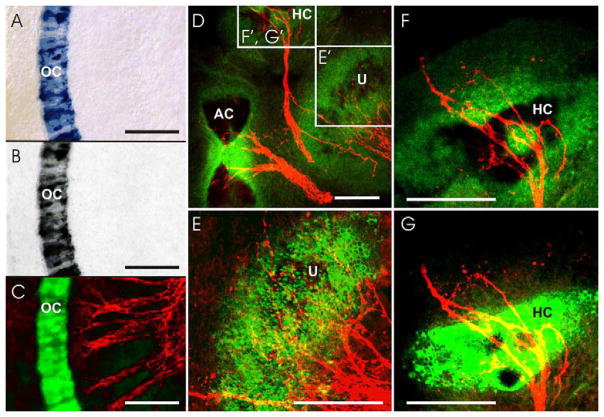
Imaging of the BCI precipitate of β-galactosidase is compared for transmitted light (A, B), epifluorescent light (C), confocal microscopy without (D, F) and with (E, G) 720 nm photoactivation. The BCI precipitate in cochlear hair cells absorbs rhodamine (568 nm) excitation fluorescence and can be electronically inverted to yield a signal, here false colored as green (C). Such imaging is comparable to either simple transmitted light (A) or transmitted light with a red rhodamine filter (B). Imaging the BCI precipitate with 488 nm excitation shows absorption of the background epifluorescent signal (D, F), while allowing nerve fibers stained using an Alexa 647-conjugated secondary antibody to be visualized (red fibers in D, F). Photoactivation with 720 nm excitation results in emission of a strong 488 nm-excited fluorescent signal in tissue areas of low BCI precipitate concentration (E, G). Note that high levels of BCI cause quenching, yielding a black hole in the fluorescence (G). Boxes in D are shown at higher magnification in E–G. Abbreviations: AC, anterior crista; HC, horizontal crista; OC, organ of Corti; U, utricle. Scale bar: 100 μm.

