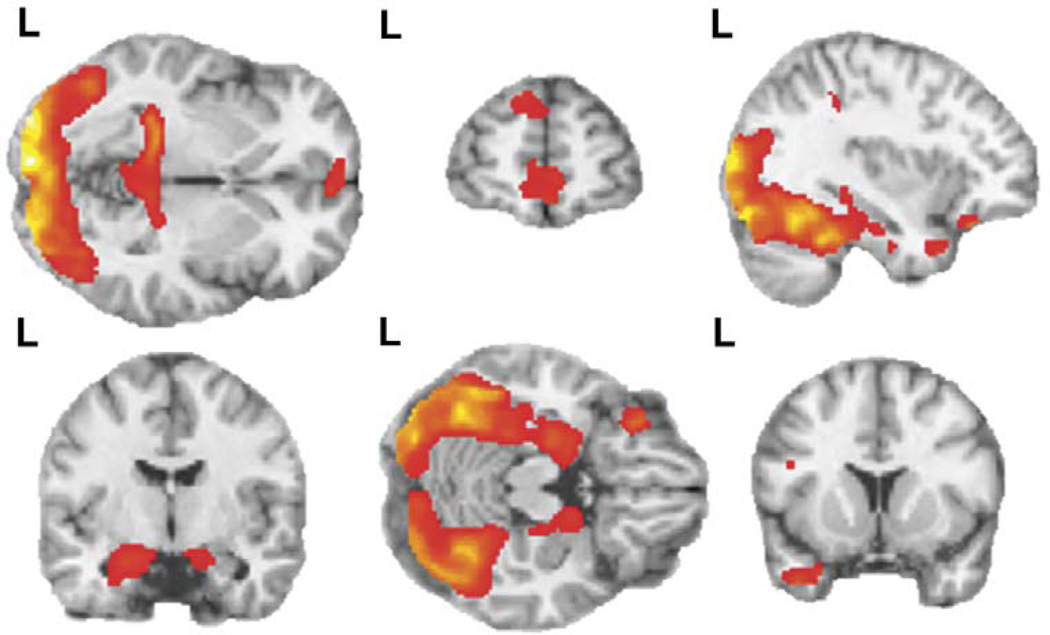
Figure 2. Brain activation during comparison of visual cannabis cues > Gaussian baseline.
Both rows depict activation in response to visual cannabis cues versus baseline (activation is overlaid on sagittal, coronal, and horizontal sections of MNI single subject template). There were four clusters bilaterally in the occipital cortex including portions of calcarine, lingual, cuneus, fusiform and middle occipital gyri (Table 2). Four clusters were activated in bilateral temporal lobe, including parahippocampal gyrus, hippocampus, and amygdala. An additional confluent cluster included regions in both the occipital cortex and parahippocampal gyrus. Further clusters were present in the temporal gyrus including the superior temporal pole (left) and middle temporal gyrus (bilaterally), and in the posterior cingulate (bilaterally). In frontal cortex, activated clusters included the inferior orbitofrontal cortex (left), superior frontal gyrus (bilaterally), and medial frontal gyrus (left). Voxel threshold p=0.001, extent threshold k=30; for display, gray matter mask removed to show regional continuity. t-score color bar corresponding to activated regions is shown in figure 2. L=left side of brain for each figure.

