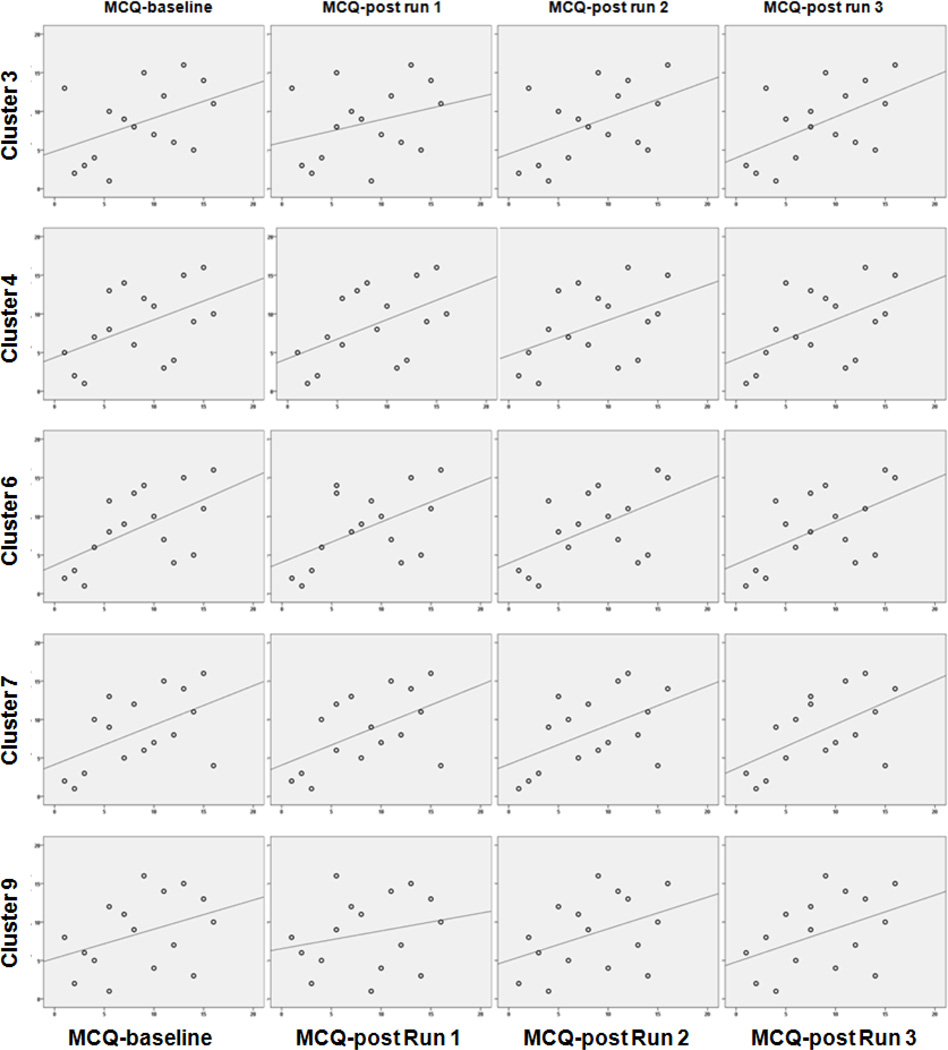
Figure 3. Correlation of MCQ craving score with BOLD signal intensity (cannabis>Gaussian baseline) during Run 1.
Scatterplots of craving score correlation with activation (BOLD signal intensity from the contrast of cannabis cues>Gaussian images) from Run 1. Rows correspond to the 5 clusters (highlighted in bold font in Table 2) that showed at least one significant correlation of marijuana craving questionnaire (MCQ) total score and BOLD signal intensity-run 1. X-axes indicate rank MCQ score from left to right as MCQ-baseline, MCQ-post run 1, MCQ-post run 2, MCQ-post run 3. Y-axes indicate rank BOLD signal intensity-run 1 extracted from each cluster. Correlations coefficients for the depicted data are shown in Table 2.

